Introduction to Graphs for Class 8

Table of Content

In the vast landscape of mathematics, graphs serve as a fundamental tool for modelling and understanding relationships between entities. Graphs provide a visual and mathematical abstraction for analysing intricate relationships. In this chapter, we will delve deeper into the realms of how a solid understanding of linear graphs becomes increasingly essential, unlocking new possibilities for solving complex problems and uncovering hidden patterns.

  • Graph
  • Cartesian Plane
  • Quadrants
  • Graph

    A graph is like a visual map that helps us understand the connections between things. It has points (called nodes) and lines (called edges) that show how these points are linked. Graphs are used in many places such as showing the shortest route on a map. They make complex relationships easy to see and understand, helping us analyse and visually solve problems.

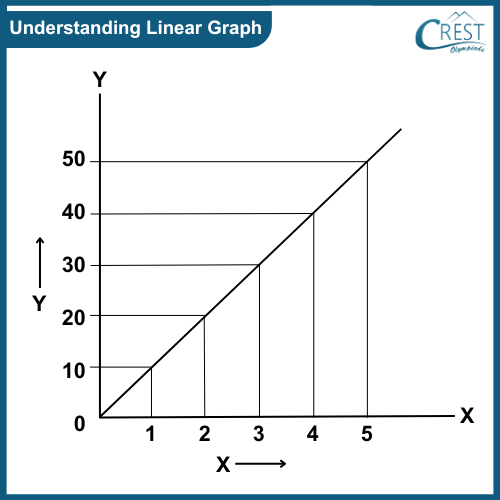
    Understanding Linear Graph

    A linear graph is a graphical representation of a straight line that shows the connection between the horizontal line (x-axis) and the vertical line (y-axis). Imagine it as drawing a line that goes straight up or down.

    The given graph is called a linear graph.

    cmo-graphs-c8-1

    Cartesian Plane

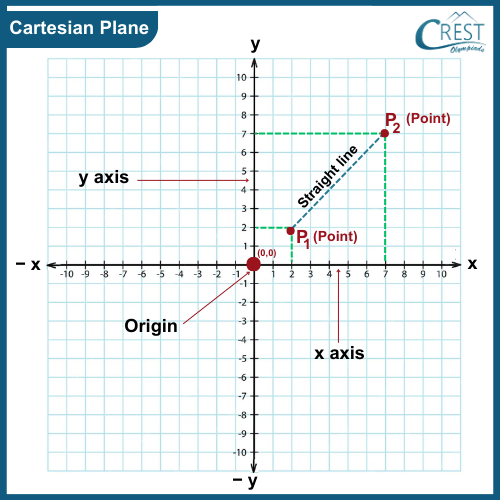
    A cartesian plane is a flat space where we locate points using two lines. One line goes left and right (horizontal line) and the other goes up and down (vertical line). This horizontal line is the x-axis and this vertical line is the y-axis. These lines meet at a right angle like a corner. Together, they are coordinate axes or cartesian axes.

    The point at which these two axes (x and y axes) meet is called the "origin" and it is represented by the letter ‘O’. It is located at (0, 0).

    cmo-graphs-c8-2

    So, when we draw a straight line to show a relationship between two quantities like time and distance or cost and quantity, we are creating a linear graph. We use the cartesian plane to give us a clear picture of where quantities are in relation to each other. It is like a map of points on a graph.

    Coordinates of Ordered Pair

    Any points on the cartesian plane represent an ordered pair of points. The coordinates of any point are represented by an ordered pair (x, y).

    It is like giving an address to a location, we use the x and y values to pinpoint our spot on a graph.

    The coordinates of a point are described below:

    → x-coordinate (Abscissa): This coordinate is about how far left or right the point is. It is measured as the distance horizontally along the x-axis.

    → y-coordinate (Ordinate): This coordinate is about how far up or down the point is. It is measured as the distance vertically along the y-axis.

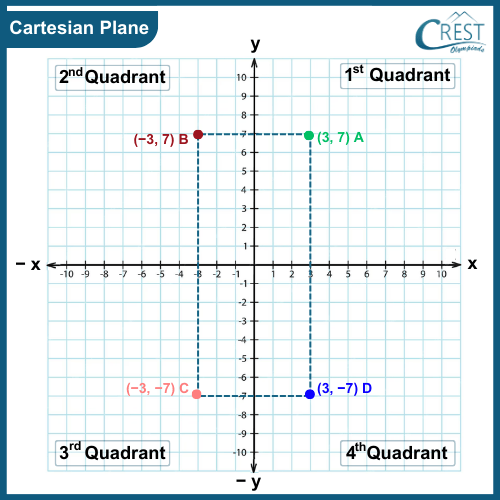
    (3, 7), (−3, 7), (−3, −7) and (3,−7) are coordinates of different points.

    Quadrants

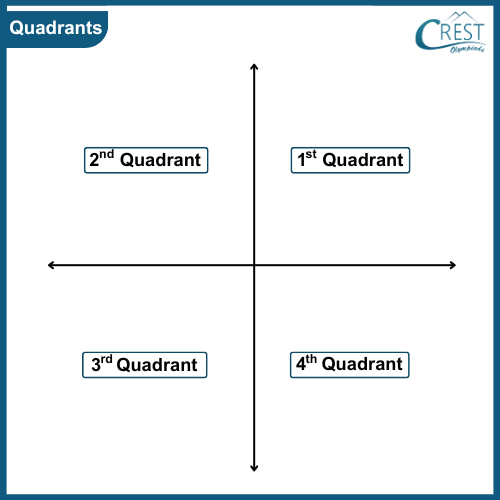
    The coordinate axes divide the cartesian plane into four parts. These parts are quadrants. They are the first quadrant, the second quadrant, the third quadrant and the fourth quadrant. The different quadrants are shown as

    cmo-graphs-c8-3

    Signs of Quadrants

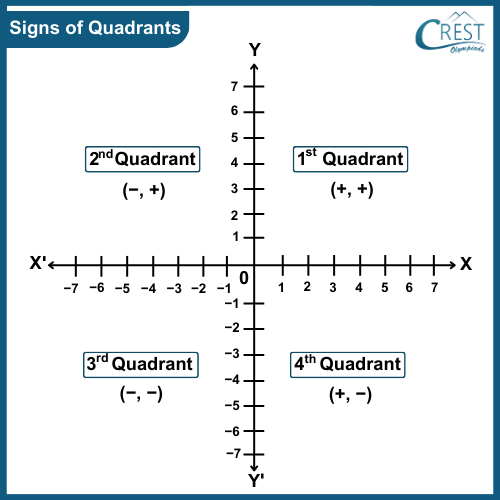
    Each quadrant is like a different corner of our graph and they help us understand where points are located based on their positive or negative values.
    The signs of quadrants are shown as

    cmo-graphs-c8-4

    The table shows the signs of coordinates in different quadrants:

    Quadrants

    x-coordinate (Abscissa)

    y-coordinate (Ordinate)


    Examples

    1st Quadrant

    Positive (+)

    Positive (+)

    (3, 7)

    2nd Quadrant

    Negative (−)

    Positive (+)

    (−3, 7)

    3rd Quadrant

    Negative (−)

    Negative (−)

    (−3, −7)

    4th Quadrant

    Positive (+)

    Negative (−)

    (3, −7)

    The graph describes the positions of different points:

    cmo-graphs-c8-5

    Quick Video Recap

    In this section, you will find interesting and well-explained topic-wise video summary of the topic, perfect for quick revision before your Olympiad exams.

    ***COMING SOON***

    ×

    >> Join CREST Olympiads WhatsApp Channel for latest updates.

    Curio - AI Doubt Solver

    This is Curio, your AI Doubt Solver. Here to help you with any educational doubts you encounter while preparing for your Olympiad exams. Feel free to ask questions and learn!

    Share Your Feedback

    CREST Olympiads has launched this initiative to provide free reading and practice material. In order to make this content more useful, we solicit your feedback.

    Do share improvements at info@crestolympiads.com. Please mention the URL of the page and topic name with improvements needed. You may include screenshots, URLs of other sites, etc. which can help our Subject Experts to understand your suggestions easily.

    Maths Related Topics for Class 8

    Other Subjects for Class 8

    ×
    70%