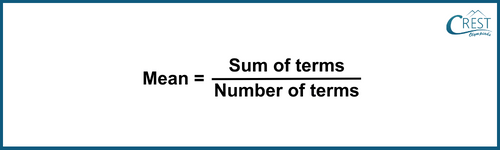
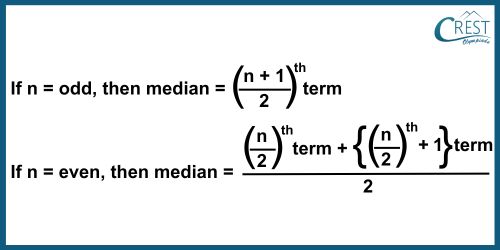
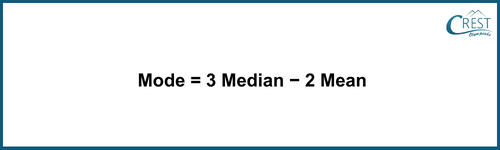
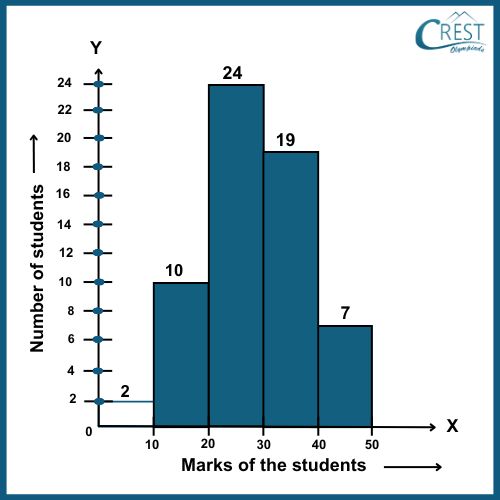
Data Handling

Data Handling - Sub Topics

In the digital age, data is a valuable asset. The effective handling of data has become paramount. Data handling encompasses collecting, storing, processing and retrieving information, demanding careful consideration to ensure accuracy, security and efficiency. In this chapter, we will explore key strategies for mastering the art of data handling. It includes mean, median and mode, bar graphs, histograms and pie charts which are superhero tools for solving problems and learning cool things about the world. Graphs become even more important and help us tackle tricky puzzles. It is an exciting adventure into understanding how things are connected in our complex world!

  • Statistics
  • Histogram
  • Bar Graph
  • Pie Graph
  • Event
  • Probability
  • Solved Questions on Data Handling
  • Data: Data is information that we collect for a specific reason. It is the facts and details we gather to learn or understand better. Data can be stored in tables, graphs, charts, maps or any other relevant sheets. Data is arranged in rows and columns, as shown in the given figure:

    cmo-data-c8-1

    Raw Data: Raw data is the information we gather in its original form. The raw data is used to extract the data as shown:

    cmo-data-c8-2

    Range: Range is the difference between the highest and lowest values in a data set. The range can be found after arranging the data in ascending or descending order.

    Range = Maximum value − Minimum value

    The range of the given data is shown as:

    cmo-data-c8-3

    Array: An array is a way of arranging data in a particular order. You can arrange numbers or items from the smallest to the largest (ascending order) or from the largest to the smallest (descending order).

    cmo-data-c8-4

    Frequency: Frequency is how many times something happens or appears in a set of information. It helps us understand which elements are more common or less common in a collection of data. The frequency of balloons is shown as:

    cmo-data-c8-5

    Tally Marks: Tally marks are used to count how often something occurs when we have a lot of data.

    For example, there are 20 students in a class and their favourite subjects are recorded as follows:

    Science, Mathematics, English, General Knowledge, Science, Mathematics, English, Science, General Knowledge, Mathematics, Science, English, General Knowledge,  Mathematics, English, Mathematics, Mathematics, English, General Knowledge, Science

    In this case, the table shows the favourite subjects of 20 students.

    cmo-data-c8-6

    Frequency Distribution Table: A frequency distribution table is a table that shows how many times each piece of information appears in a group of data. The given frequency distribution table shows the number on a dice and their frequency when a dice is rolled several times.

    cmo-data-c8-7

    Ungrouped Frequency Distribution: Ungrouped data is data that has not been organized into groups. It is also called raw data. When we write down a bunch of information in a table that shows how often each thing appears, it is called an ungrouped frequency distribution of raw data. Basically, it is a way of organizing data by counting how many times each piece of information shows up.

    The given frequency distribution table holds ungrouped data.

    Age in years (DATA)

    Number of students in a school (Frequency)

    3

    56

    4

    67

    5

    89

    6

    86

    7

    94

    8

    92

    9

    101

    10

    90

    Grouped frequency distribution: Grouped data is data that has been organized into groups.

    The given frequency distribution table holds grouped data.

    Age in years (DATA)

    Number of students in a school (Frequency)

    3-4

    123

    5-6

    175

    7-8

    186

    9-10

    191

    Class Interval: In grouped data, a class interval is a range that includes a set of values. 

    Class Intervals from the above frequency distribution table are 3-4, 5-6, 7-8 and 9-10.

    Lower Limit and Upper Limit: In a class interval, the starting number (lower value) is called the lower limit and the ending number (upper value) is called the upper limit. It is like having a range of values and these two limits tell you where that range begins and where it ends.

    From the above frequency distribution table, in a class interval 5-6, the lower-class limit is 5 and the upper-class limit is 6.

    Size or Width of the Class Interval: Size or width of the class interval is the difference between the upper limit and the lower limit of the same group. It measures how big each group or range is in your data.

    From the above frequency distribution table, for the class interval 5-6, the class size is 1, i.e., (6 − 5 = 1).

    Class Mark: A class mark is the middle point of a class interval. It is like finding the average or midpoint within a range of values.

    cmo-data-c8-8

    From the above frequency distribution table, for the class interval 5-6,
    Class Mark = (5 + 6)/2 = 11/2 = 5.5

    The given frequency distribution table describes class intervals, frequency, lower and upper limit, class size or width and class mark.

    Class Intervals (Age in years)

    Frequency

    (Number of students in a school)

    Lower Limit and
    Upper Limit

    Class Size
    or
    Width

    Class Mark

    1-2

    192

    Lower Limit = 1

    Upper Limit = 2

    2 − 1 = 1

    (1 + 2)/2 = 1.5

    3-4

    190

    Lower Limit = 3

    Upper Limit = 4

    4 − 3 = 1

    (3 + 4)/2 = 3.5

    5-6

    180

    Lower Limit = 5

    Upper Limit = 6

    6 − 5 = 1

    (5 + 6)/2 = 5.5

    7-8

    186

    Lower Limit = 7

    Upper Limit = 8

    8 − 7 = 1

    (7 + 8)/2 = 7.5

    9-10

    191

    Lower Limit = 9

    Upper Limit = 10

    10 − 9 = 1

    (9 + 10)/2 = 9.5

    Statistics

    Statistics is a special branch of mathematics that helps us make sense of lots and lots of numbers.

    Imagine you have a big pile of marble and you want to know things like how many are red, how many are blue and which colour is the most popular. Well, statistics is the magic tool that helps us do that! It helps us collect, look at, understand and talk about all those numbers.

    Terms related to Statistics

    Mean: Mean is the average value of a group of numbers. To find the mean, you add up all the numbers and then divide by how many numbers there are. It is like finding the middle value when you add everything up. The mean is calculated by:

    cmo-data-c8-9

    Median: The median is the middle value in a set of numbers or data. It is the number right at the centre when you arrange them either in ascending or descending order. The median is calculated by:

    cmo-data-c8-10

    Note:
    a) For an odd number of observations, the median is the middle value.
    b) For an even number of observations, the median is the average of the two middle values.

    Mode: The mode of the data set is the most common number in the data set. The easiest way to find the mode is to arrange the numbers from the smallest to the largest. Then, we need to count the number of times each number occurs. The mode is the number that occurs the most. The mode is calculated by:

    Mode = Value of the number which occurs the most

    Empirical Formula: The empirical formula gives the relationship between mean, median and mode.

    cmo-data-c8-11

    Histogram

    A histogram is a pictorial representation of numerical data that shows information about grouped data. On the graph, class intervals are shown on the bottom which goes from left to right (that is the horizontal axis) and frequencies are shown on the up-and-down axis (that is the vertical axis). It is a way of seeing patterns and trends in data using bars on a graph. The histogram shows the marks obtained by the students.

    cmo-data-c8-12

    Bar Graph

    A bar graph is a pictorial representation of data that shows numbers using bars (rectangles). The bars are all the same width but have different heights. The bars are either vertical or horizontal and they are evenly spaced. It is a simple way of representing information visually and making it easier to compare different values. The bar graph shows the marks obtained by the students.

    cmo-data-c8-13

    Pie Graph

    A pie graph is a pictorial representation of showing numbers by dividing a circle into slices. Each slice represents a part of the whole dataset. It is like cutting a pie into pieces and each piece shows how much of the total it represents.

    cmo-data-c8-14

    Pie chart shows the favourite subjects of students.

    cmo-data-c8-15

    Event

    An event is what happens or the result that you get in an experiment. It could be one specific outcome or a group of outcomes.

    Probability

    Probability is the possibility of the outcome of any random event. It is a way of expressing how likely it is for a random event to turn out a certain way.
    The study of events using probability is called statistics.

    If an event is certain to happen, then the probability is 1.
    If an event is impossible, then the probability is 0.
    The probability is always between 0 and 1, never more or less.

    Formula to find Probability:

    cmo-data-c8-16

    Share Your Feedback

    CREST Olympiads has launched this initiative to provide free reading and practice material. In order to make this content more useful, we solicit your feedback.

    Do share improvements at info@crestolympiads.com. Please mention the URL of the page and topic name with improvements needed. You may include screenshots, URLs of other sites, etc. which can help our Subject Experts to understand your suggestions easily.

    Maths Related Topics for Class 8

    70%