Solved Questions on Data Handling
Directions(1-2):Carefully observe the bar graph which represents the height of the different trees in feet and answer the following questions.
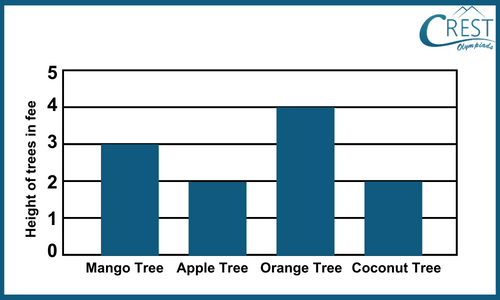
1. What is the difference in the heights of mango and coconut trees?
a) 1 foot
b) 2 feet
c) 3 feet
d) 4 feet
Answer: a) 1 foot
Explanation: From the graph,
Height of mango tree = 3 feet
Height of coconut tree = 2 feet
The difference in the heights of mango and coconut trees = 3 − 2
= 1 foot
2.The given pictograph shows the number of oranges sold over four weeks. Read the graph carefully and answer the following question:
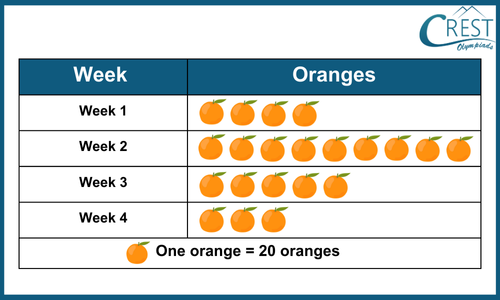
How many more oranges were sold in Week 2 than Week 3?
a) 80
b) 40
c) 160
d) 20
Answer: a) 80
Explanation:
Number of oranges sold in Week 2 = 9 x 20 = 180
Number of oranges sold in Week 3 = 5 x 20 = 100
Difference between the number of oranges sold in Week 2 and Week 3 = 180 - 100 = 80
3. The below pictograph shows the information regarding the names of people who purchased apples. Answer the following questions based on this pictograph.
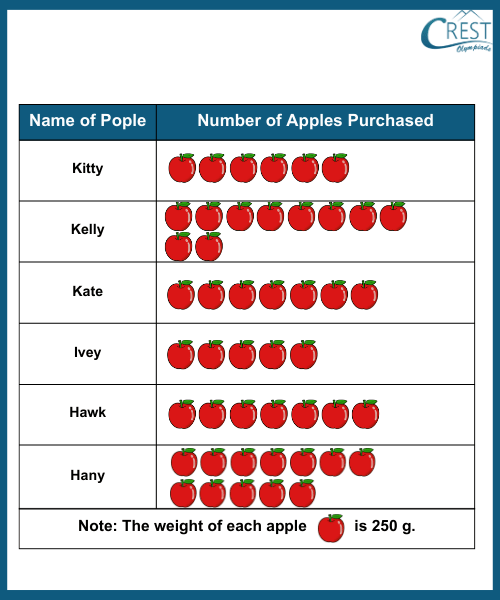
What is the quantity of apples purchased by Kelly?
a) 1 kg 500 g
b) 2 kg 500 g
c) 1 kg 750 g
d) 2 kg 750 g
Answer: b) 2 kg 500 g
Explanation: Weight of each apple is 250 g.
The number of apples purchased by Kelly = 10
Weight of apples purchased by Kelly = 10 × 250
= 2500 g
= 2000 g + 500 g
= 2 kg 500 g
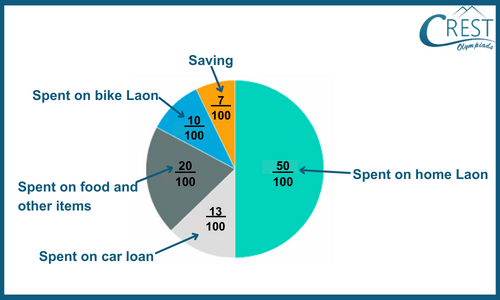
Directions (4-5): The pie chart details the fractions of the expenditures and savings of Racky. Carefully observe the pie chart and answer the following questions:
4. What is the amount of money saved if the salary of Racky is one thousand four hundred dollars?
a) $2
b) $58
c) $98
d) $118
Answer: c)$98
Explanation: Fraction of saving money = 7/100
Salary of Racky = $1400
Amount of money saved = (7/100) × 1400
= 7 × 14
= $98
5. What is the amount of money spent on a home, car and bike loans if the salary of Racky is three thousand dollars?
a) $2,090
b) $2,190
c) $2,290
d) $2,590
Answer: b) $2,190
Explanation: Fraction of money spent on home loan = 50/100
Fraction of money spent on car loan = 13/100
Fraction of money spent on bike loan = 10/100
Total fractions of money spent on home, car and bike loans = (50/100) + (13/100) + (10/100)
= 73/100
Salary of Racky = $3,000
Amount of money saved = (73/100) × 3,000
= 73 × 30
= $2,19