Data Handling

Data Handling - Sub Topics

In this chapter, we deal with data handling. So, data handling with pictures and bars helps us see and understand numbers in a way that's easy and enjoyable. These pictures help us understand the data better. It is like telling a story with pictures and it makes learning about numbers and information more fun and interesting!

  • Data Handling
  • Types of Graphs and Charts
  • Solved Questions on Data Handling
  • Data Handling

    Data handling involves the use of visual representations of numerical values such as images, bars or figures to facilitate the students' comprehension of the data.

    In data handling, we use pictures, bars or figures to show numbers and information.

    Why do we do this?

    Well, it is because when we can see things visually, it is much easier to understand.

    Types of Graphs and Charts

    Pictograph: A pictogram is a visual representation of information using images or symbols. A pictogram falls into the data handling category where we use images to represent numerical values or data in a chart or graph.

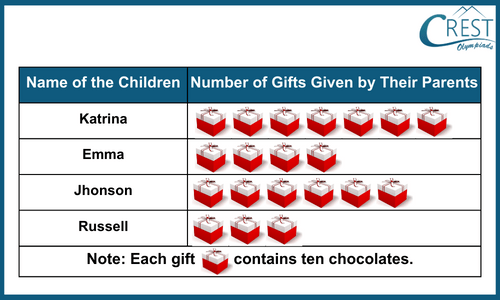
    The below pictograph shows the data on the gifts given by their parents to their children.

    cmo-data-c4-1

    First, we need to know what the picture above means.

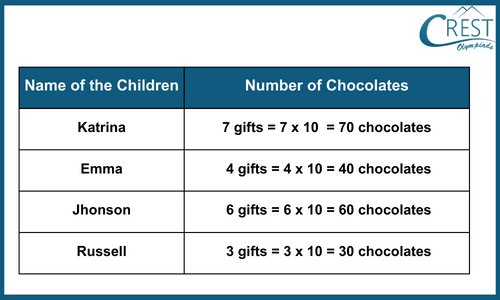
    The picture above shows four children being presented with different numbers of gifts. One important thing to remember is that each gift contains ten chocolates. So, if there are 3 gifts presented to Russell, it means 3 times 10 chocolates, which is 30 chocolates.

    The table helps us understand and explain the information provided above.

    cmo-data-c4-2

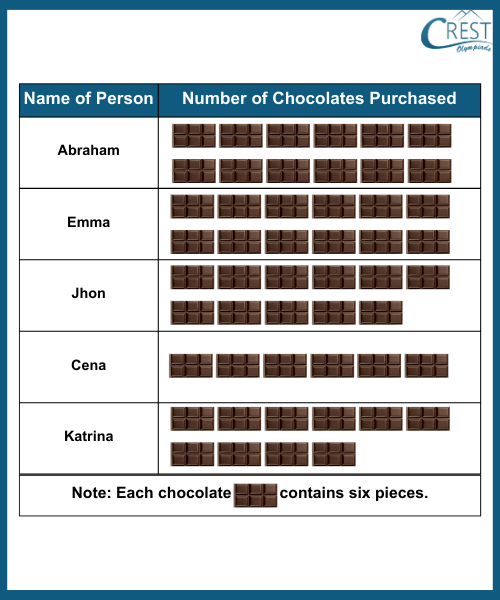
    Example: The pictograph shows the data based on the names of people who purchased chocolates. Observe the pictograph carefully and answer the following question based on the information given below.

    cmo-data-c4-3

    How many pieces of chocolates were purchased by Katrina and Emma together?

    a) 112
    b) 132
    c) 152
    d) 172

    Answer: b) 132

    Explanation: Each chocolate contains 6 pieces.

    Number of chocolates purchased by Katrina = 10 Chocolates

    Number of pieces of chocolates purchased by Katrina = 10 × 6 = 60

    Number of chocolates purchased by Emma = 12 Chocolates

    Number of pieces of chocolates purchased by Emma = 12 × 6
                                                                                = 72

    Total number of pieces of chocolates purchased by Katrina and Emma = 60 + 72
                                                                                                         = 132

    → Bar graph: A bar chart or bar graph is a representation of the data in bar form. It is a useful tool for comparing items among different groups. The bar height indicates the quantity measured. It is also known as a column graph.

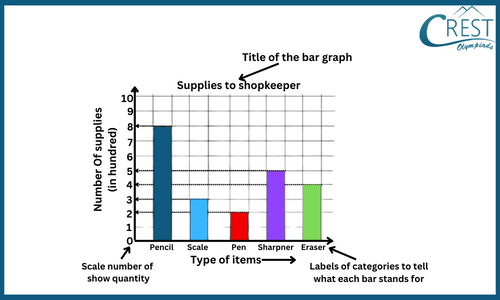
    The bar graph below shows the types of supplies and the number of supplies per shopkeeper. The higher the bar height, the higher the number of supplies or items per student. The labelled bar graph is shown as:

    cmo-data-c4-4

    The above bar graph indicates that the distribution of pencils is highest while the distribution of pens is lowest.

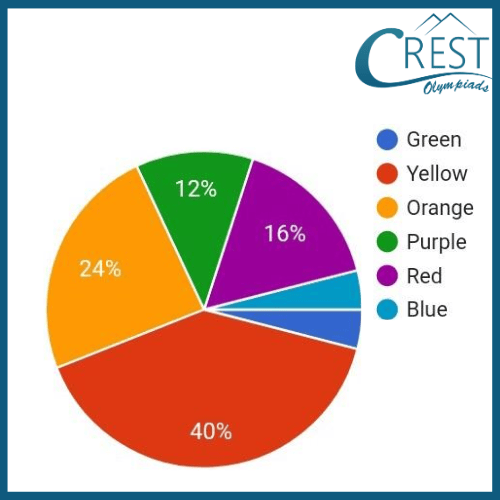
    → Pie chart: A pie chart is basically a round graph that is cut into pieces to show how much of a difference there is between two numbers.

    A pie chart is like a pizza. But instead of slices of pizza, we use it to show numbers.

    Imagine you have some data about your favourite colours: blue, red, green, yellow and pink. You want to show how much you and your friends like each colour. Each slice of the pie represents how much we like a colour.

    cmo-data-c4-5

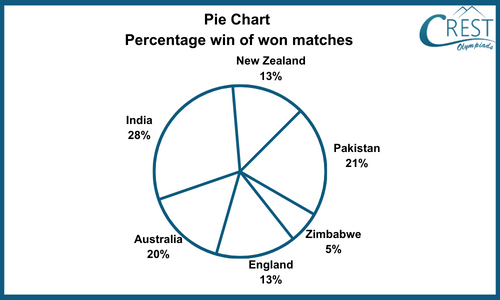
    Example: Carefully observe the pie chart and answer the following question.

    cmo-data-c4-6

    What is the losing Percentage for England?

    a) 73 %
    b) 80 %
    c) 87 %
    d) 97 %

    Answer: c) 87 %

    Explanation: Losing Percentage for England = 100 − Winning Percentage for England
                                                                      = 100 − 13
                                                                      = 87 %

    Share Your Feedback

    CREST Olympiads has launched this initiative to provide free reading and practice material. In order to make this content more useful, we solicit your feedback.

    Do share improvements at info@crestolympiads.com. Please mention the URL of the page and topic name with improvements needed. You may include screenshots, URLs of other sites, etc. which can help our Subject Experts to understand your suggestions easily.

    Maths Related Topics for Class 4

    70%