Statistics | Maths Grade 9

Statistics - Sub Topics

In the vast landscape of mathematics, statistics emerges as a guiding star illuminating the path to a deeper understanding of data and its significance. This chapter embarks on a journey into the world of statistics which explores its key concepts, applications and the profound impact it has on shaping our understanding of the world. Each topic provides a foundational understanding of statistical concepts and lays the groundwork for more advanced studies in later grades.

  • Statistics
  • Mean
  • Median
  • Mode
  • Histogram
  • Bar graph
  • Pie Chart
  • Frequency Polygon Graph
  • Solved Questions on Statistics
  • Statistics

    Statistics is a branch of mathematics that involves collecting, analysing, interpreting, presenting, and organising data.

    Data: Data refers to information or facts collected for analysis. Statistica

    l data come in two main types: Primary data and Secondary data.

    Primary Data: Primary data is information collected directly from its source for a specific purpose. The primary data is original and has not been previously collected or processed for another study.

    Secondary Data: Secondary data is information that has already been collected, processed and published for a different purpose.

    Presentation of Data: After collecting data, researchers need to organise it in a clear way to study its important features. This arrangement is called the presentation of data.

    Raw Data: When the data is just as it was collected, it is called raw data. If the raw data is organized in ascending or descending order, it becomes an array or arranged data.

    Frequency: In a set of data, how many times a specific observation shows up is called its frequency.

    Grouped data: Grouped data refers to a way of organising and presenting a set of observations that have been grouped into specific intervals.

    Frequency Distribution: Frequency distribution is a way of organising and summarising data, especially when dealing with large datasets.

    Frequency Distribution Table: The frequency distribution table provides a concise summary of the distribution of information, making it easier to analyse and interpret the data.

    Let's consider an example of a set of data that describes the number of hours students spend on homework per week. The data is grouped into intervals and the frequencies represent the number of students in each interval.

    Time spent on homework in hours (Interval)

    Number of students (Frequency)

    0-5

    7

    5-10

    8

    10-15

    6

    15-20

    4

    20-25

    7

    25-30

    3

    Class Intervals: The groups in which all the observations are divided are called class intervals.

    Lower Limit and Upper Limit: The lowest value of a group range is called the lower limit, and the highest value is called the upper limit.
    Suppose class interval is 15−20, then 15 is called lower limit and 20 is called upper limit of the class.

    Class Size: The gap between the upper and lower limits is known as the size or width of the group range.

    Class Mark: The middle value of a group range is referred to as its class mark.

    cmo-statistics-c9-1

    Central Tendency: Central tendency refers to the statistical measure that represents the centre or middle of a distribution.
    There are three measures of central tendency:
    (i) Mean
    (ii) Median
    (iii) Mode

    Mean

    The mean of a set of data is the average of a set of numbers and it calculates the "central" value of the numbers.

    To calculate the mean of grouped data, it is assumed that the frequency of each class interval is centred around its mid-point.

    cmo-statistics-c9-2

    Mean of the data = Sum of all the ObservationsTotal number of observations = fxf

    Median

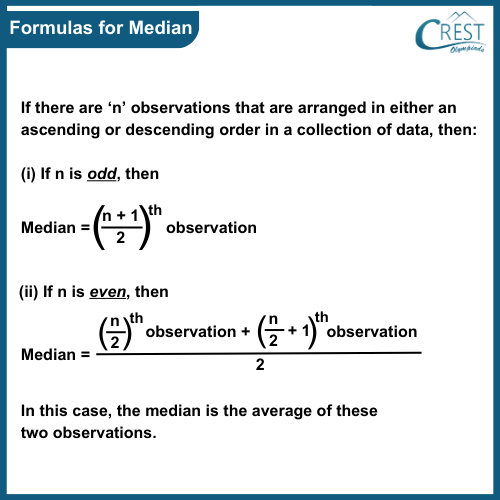
    The median of a set of data is a value in the middle of a set of numbers or data. It represents the midpoint in a list where there is an equal chance for values to be above or below it in a frequency distribution.

    Formulas for Median:

    If there are ‘n’ observations that are arranged in either an ascending or descending order in a collection of data, then:

    cmo-statistics-c9-3

    Mode

    The mode of a set of data is the observation that appears most frequently.

    Empirical Formula

    The empirical relationship between mean, median and mode is given by:

    (i) Mode = 3 Median − 2 Mean

    (i) Mean = ½ (3 Median − Mode)

    (iii) Median = ? (Mode + 2 Mean)

    Histogram

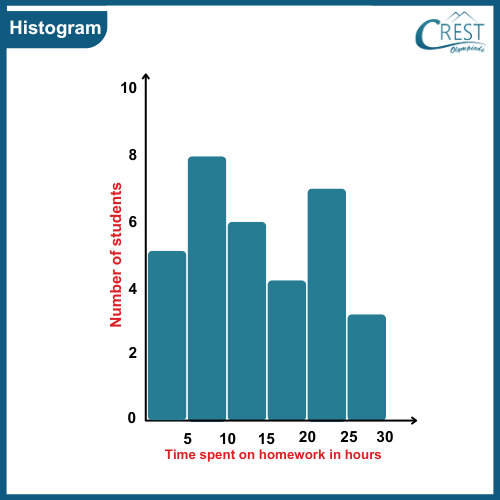
    A histogram is a visual way to represent grouped data. On a graph, the class intervals are shown on the horizontal axis (x-axis) and the corresponding class frequencies are represented on the vertical axis (y-axis). This provides a clear picture of how the data is distributed.

    Let's consider an example of a histogram using data on the number of hours students spend on homework per week. The frequency distribution table of the following histogram is displayed above.

    cmo-statistics-c9-4

    Bar graph

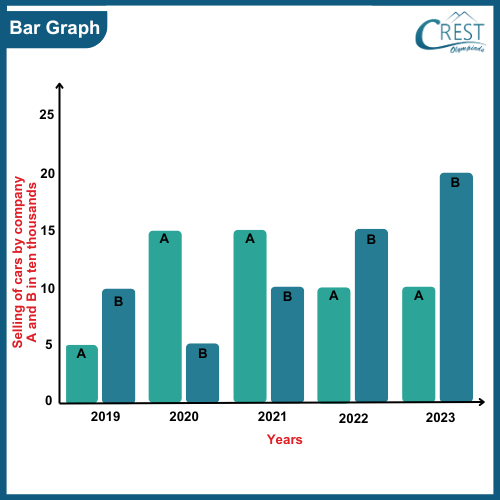
    A bar graph is a visual way to represent data that hasn’t been grouped into categories. It is also known as a bar chart. They have lines (axes) and bars that are either horizontal or vertical and labelled to provide information.

    Let's consider a bar graph representing the number of cars sold by companies A and B in 5 years:

    cmo-statistics-c9-5

    Pie Chart

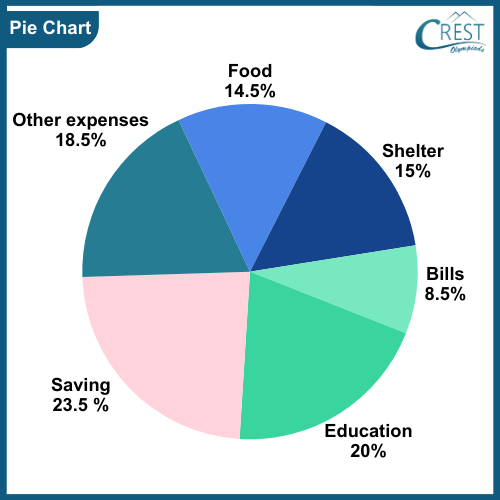
    A pie chart is a way to show numerical data visually using a circle. The circle is divided into sectors and each sector represents a portion of the total data.
    The central angle of each sector in a pie chart is:

    cmo-statistics-c9-6

    Let's consider a pie chart representing the expenses and savings of an employee for a year:

    cmo-statistics-c9-7

    Frequency Polygon Graph

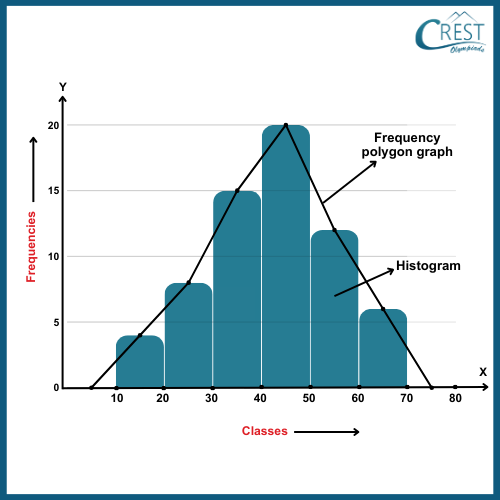
    A frequency polygon graph is a shape formed by connecting the midpoints of the upper edges of the bars in a histogram or by connecting the points formed by class mark and its corresponding frequency.

    Construction of a Frequency Polygon Graph with Histogram:

    1. Draw a histogram using frequency distribution.
    2. Find the midpoints of the upper edges of each histogram bar and connect these midpoints with dotted lines.
    3. Identify midpoints for two class intervals with zero frequency on the X-axis, one on the left and one on the right. These are called imagined class intervals.
    4. Complete the frequency polygon graph by connecting the midpoints of the first and last class intervals to the midpoints of the imagined intervals adjacent to them.

    Frequency Polygon Graph Using a Histogram:

    cmo-statistics-c9-8

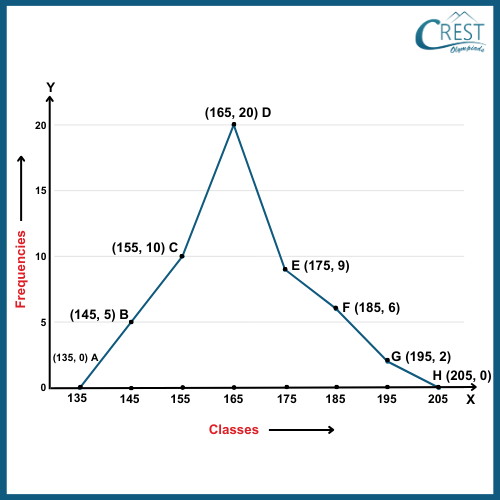
    Construction of a Frequency Polygon Graph without Using a Histogram:

    1. Calculate the midpoints (class marks) of the class intervals using frequency distribution table.
    2. Represent class marks on the X-axis with a suitable scale.
    3. Represent frequencies on the Y-axis with a suitable scale.
    4. Plot the points (x, f) where x is the class mark and f is the corresponding frequency. Connect the plotted points with line segments.
    5. Include two class intervals with zero frequency at the beginning and end. Find their midpoints known as imagined classes.
    6. Complete the frequency polygon graph by connecting the midpoints of the first and last class intervals to the midpoints of the imagined classes adjacent to them.

    The frequency distribution of the data is shown as:

    Classes

    140-150

    150-160

    160-170

    170-180

    180-190

    190-200

    Class Marks

    145

    155

    165

    175

    185

    195

    Frequencies

    5

    10

    20

    9

    6

    2

    Frequency Polygon Graph without Using a Histogram:

    cmo-statistics-c9-9

    Share Your Feedback

    CREST Olympiads has launched this initiative to provide free reading and practice material. In order to make this content more useful, we solicit your feedback.

    Do share improvements at info@crestolympiads.com. Please mention the URL of the page and topic name with improvements needed. You may include screenshots, URLs of other sites, etc. which can help our Subject Experts to understand your suggestions easily.

    Maths Related Topics for Class 9

    70%