Pictographs

Pictographs - Class 2

  • Pictographs
  • Representation of Data
  • Pictographs

    A pictograph is a way to show information by using pictures or symbols. It falls under the category of data handling where we use pictures to represent numerical information or data in charts or graphs.

    Representation of Data

    The information that we collect is called data. "Representation of Data" means showing information in a clear and easy-to-understand way. We use pictures, graphs and charts to do this. It helps us understand and share information better.

    Let's use an example to make it easier to understand.

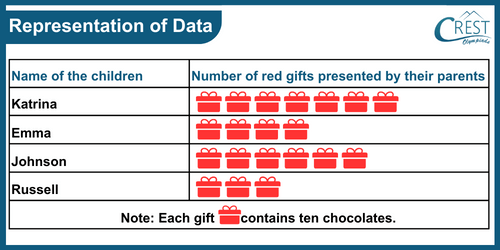
    The below pictograph shows the data on the gifts given by their parents to their children.

    Representation of Data

    First, we need to know what the picture above means.

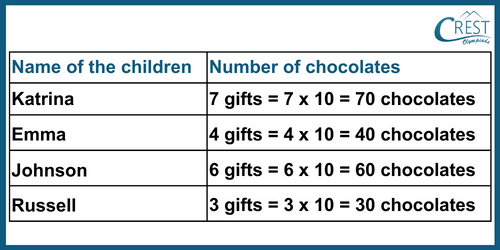
    The picture above shows four children being presented with different numbers of gifts. One important thing to remember is that each gift contains ten chocolates. So, if there are 3 gifts presented to Russell, it means 3 times 10 chocolates, which is 30 chocolates.

    The table helps us understand and explain the information provided above.

    Data representation

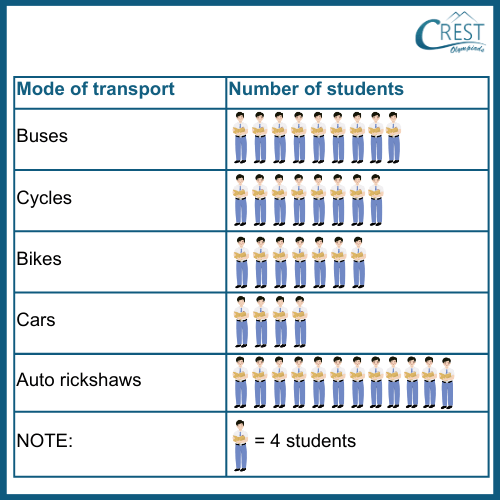
    Directions (Examples 1 and 2): The below pictograph shows the data on the number of students who prefer the given mode of transport to reach school.

    Representation of data

    Example: What is the number of students who use the cycle to reach the school?

    a) 8
    b) 16
    c) 32
    d) 64

    Answer: c) 32

    Explanation: Number of students who use the car to reach the school = 8 x 4
    = 32

    Example: How many students prefer cars and bikes?

    a) 40
    b) 44
    c) 48
    d) 52

    Answer: b) 44

    Explanation: Number of students who prefer cars = 4 x 4 = 16
    Number of students who prefer cars = 7 x 4 = 28
    Total number of students who prefer cars and bikes =16 + 28
    = 44

    Share Your Feedback

    CREST Olympiads has launched this initiative to provide free reading and practice material. In order to make this content more useful, we solicit your feedback.

    Do share improvements at info@crestolympiads.com. Please mention the URL of the page and topic name with improvements needed. You may include screenshots, URLs of other sites, etc. which can help our Subject Experts to understand your suggestions easily.

    Maths Related Topics for Class 2

    70%