Solved Examples of Line Graph
(Directions for Question 1-4)
Robert owns a bookstore and he recorded the sales of books each week over a specific time period in the form of a line graph. Examine the line graph carefully and answer the following questions.
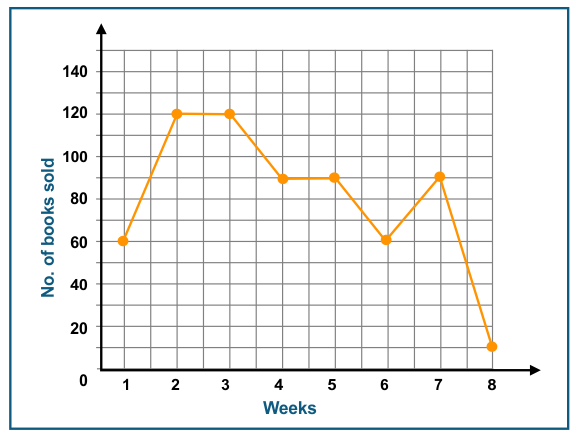
1. Calculate how many fewer books were sold in week 8 than in week 7 using the data from the line graph above.
a) 35
b) 49
c) 65
d) 80
Answer: d) 80
Explanation: In 7th week the number of books sold = 90
In the 8th week the number of books sold = 10
The difference is 90 – 10 = 80
As a result, 80 fewer books were sold in week 8 than in week 7.
2. In which two weeks the sale of the books are same?
a) 2 and 3
b) 4 and 5
c) 3 and 4
d) Both a and b
Answer: d) Both a and b.
Explanation: If we observe the above graph carefully we can say the sales are same on both a and b.
3. How many books were sold in the eighth week?
a) 10
b) 20
c) 30
d) 40
Answer: a) 10
Explanation: The number of books sold in the eighth week is 10 books.
4. What is the total number of books sold during the first and sixth weeks?
a) 60
b) 100
c) 120
d.)140
Answer: c) 120
Explanation: Number of books sold in the first week = 60
Number of books sold in the sixth week = 60
First week + sixth week = 60 + 60 = 120 books.
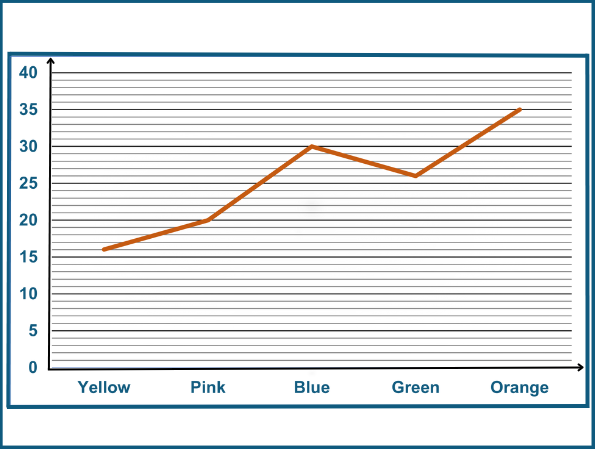
5. The following table provides details about the favourite colours of the group of people.
| Colours |
Yellow |
Pink |
Blue |
Green |
Orange |
| No. of people |
16 |
20 |
30 |
26 |
35 |
Create a line graph for the given data.
Answer: Plot the colours on the x-axis and the number of people on the y-axis to create the line graph with the given information.
Data Provided: Yellow = 16, Pink = 20, Blue = 30, Green = 26 and Orange = 35
Therefore, below is the line graph for the provided data:
Practice Questions of Line Graph
(Directions for Question 1-7)
Kel and Ali were noting the temperature on one particular day. The line graph below shows the temperature from 5 a.m. to 6 p.m. on a particular day.
Examine the line graph and answer the following questions.
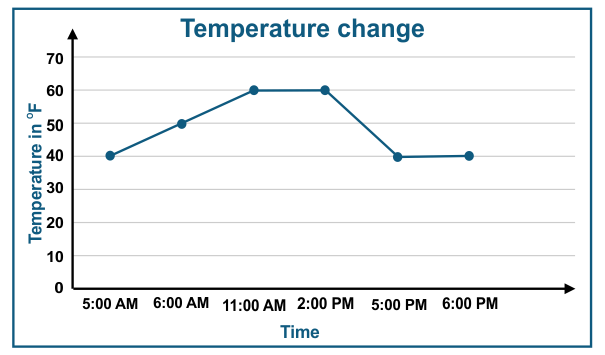
1. When was the temperature 40 degrees Fahrenheit in the morning?
a) 5 pm
b) 5 am
c) 6 am
d) 11 am
Answer: b) 5 am
2. What was the highest temperature ever recorded?
a) 60° F
b) 50° F
c) 40° F
d) 0° F
Answer: a) 60° F
3. What is the difference between the highest temperature recorded to the lowest temperature recorded?
a) 60° F
b) 40° F
c) 20° F
d) 10° F
Answer: c) 20° F
4. At what time the sudden decrease in temperature is recorded?
a) 2 pm to 5 pm
b) 5 am to 2 pm
c) 5 pm to 6 pm
d) 5 am to 6 am
Answer: a) 2 pm to 5 pm
The number of students who graduated from a college between 2009 to 2014 are represented in the following line graph. Examine the line graph and answer the following questions:
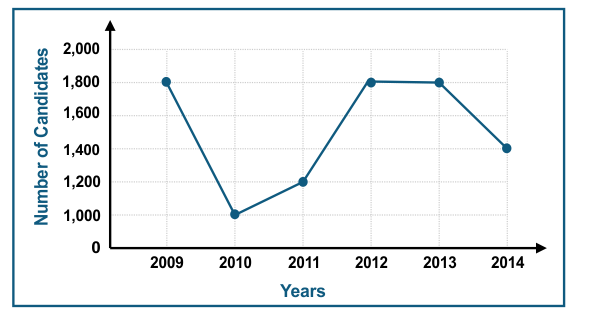
5. In 2009 how many students graduated?
a) 1400
b) 1700
c) 1600
d) 1800
Answer: d) 1800
6. What is the difference between the number of students who graduated in 2009 to the number of students graduated in 2010?
a) 600
b) 700
c) 800
d) 900
Answer: c) 800
7. How many students graduated in the year 2012 and 2013 together?
a) 1800
b) 1900
c) 2000
d) 3600
Answer: d) 3600
(Directions for Question 8-10)
Albert and Eve are the owners of a startup company, They recorded their profit in the form of a line graph shown below. (profit made in thousands of dollars)
By using the line graph below answer the following questions.
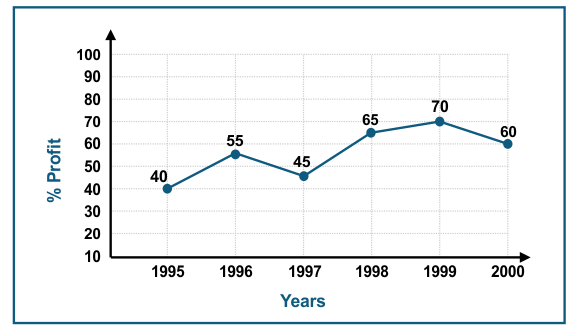
8. In which year did they make the maximum profit?
a) 1995
b) 1996
c) 1999
d) 2000
Answer: c) 1999
9. What was the average profit made between 1995 to 2000?
a) More than 50%
b) Less than 50%
c) Less than 29%
d) More than 100%
Answer: a) More than 50%
10. In which year did they make the minimum profit?
a) 1995
b) 1996
c) 1997
d) 2000
Answer: a) 1995