Line Graph - Concept & Questions

Line Graph - Sub Topics

  • Line Graph
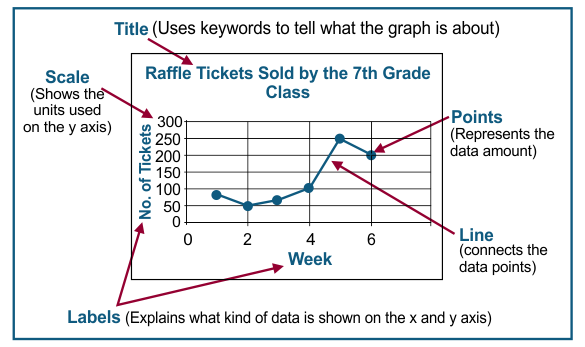
  • Parts of Line Graph
  • Line Graph

    A line graph is a graphical representation of information that changes over a period of time. It is also known as a line chart or line plot.

    It uses a series of connected points or lines to show how a certain variable or set of variables changes over time. The points or lines are plotted on a coordinate grid, with the horizontal axis representing time and the vertical axis representing the value of the variable or variables being plotted.

    Line graphs are commonly used to display data on trends, patterns, and changes in a wide range of fields, including finance, economics, statistics, and scientific research.

    Parts of Line Graph

    1. X-axis: The horizontal axis that represents the independent variable or the variable being measured.

    2. Y-axis: The vertical axis that represents the dependent variable or the variable being plotted.

    3. Data points: The individual points on the graph that represent the specific values of the independent and dependent variables.

    4. Line of best fit: The line that best represents the overall pattern of the data points.

    5. Titles: The titles of the graph that provide information about the data being plotted, including the independent and dependent variables.

    6. Legends: The labels or keys that explain the symbols or colours used in the graph.

    7. Gridlines: The lines that divide the graph into sections, make it easier to read and interpret the data.

    8. Scale: The range of values on the x-axis and y-axis, including the minimum and maximum values.

    9. Data labels: The numbers or text that indicate the specific values of the data points.

    parts-of-line-graph

    Share Your Feedback

    CREST Olympiads has launched this initiative to provide free reading and practice material. In order to make this content more useful, we solicit your feedback.

    Do share improvements at info@crestolympiads.com. Please mention the URL of the page and topic name with improvements needed. You may include screenshots, URLs of other sites, etc. which can help our Subject Experts to understand your suggestions easily.

    Mental Maths Related Topics

    70%