Solved Examples on Bar Graph
Example I:Sales of different products in a store are given in the bar graph shown below.
Study the graph carefully and answer the following questions below. (1-2)
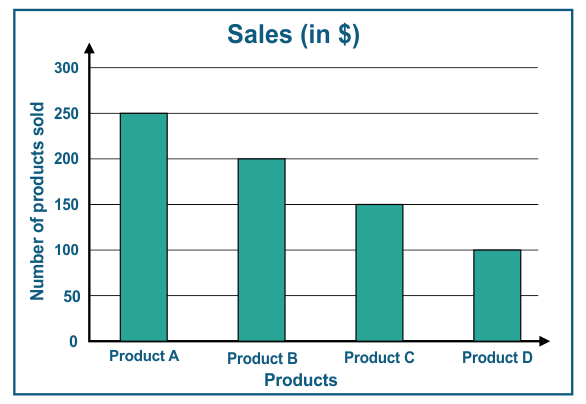
1. How many more units of Product A were sold than Product B?
a) 100
b) 50
c) 25
d) 20
Answer: b) 50
Explanation: Total units of product A = 250
Total units of product B = 200
Difference = 250 - 200 = 50
50 more units of Product A were sold than Product B.
2. What is the total number of units sold by all the products?
a) 500
b) 600
c) 700
d) 800
Answer: c) 700
Explanation: Total units = Product A + Product B + Product C + Product D
Total units = 250 + 200 + 150 + 100 = 700
Example II: The below graph shows the number of students in different grades.
Study the graph and answer the following questions. (3-4)
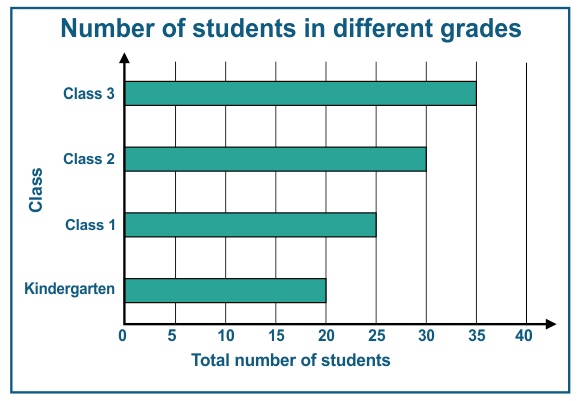
3. What is the total number of students in class 3?
a) 35
b) 30
c) 25
d) 20
Answer: a) 35
Explanation: According to the bar graph, the total number of students is 35 in class 3.
4. What is the difference between the total number of students in Class 2 and Class 3 to the total number of students in Kindergarten and Class 1?
a) 20
b) 25
c) 30
d) 35
Answer: a) 20
Explanation: According to the bar graph, Kindergarten = 20
Class 1 = 25
Class 2 = 30
Class 3 = 35
(Class 2 + Class 3) - (Kindergarten + Class 1)
65 – 45
= 20
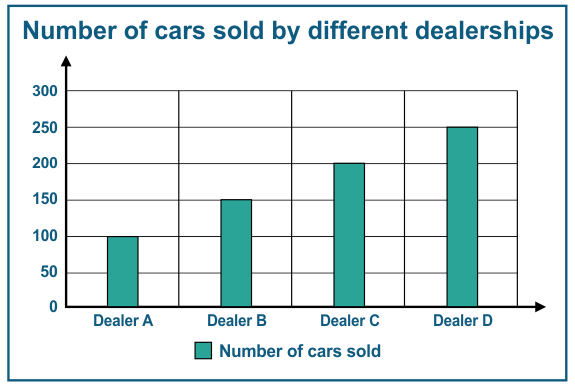
Example III: Number of cars sold by different dealerships.
| Dealership |
Number of Cars Sold |
| Dealer A |
100 |
| Dealer B |
150 |
| Dealer C |
200 |
| Dealer D |
250 |
Create a bar graph using the above information.
Explanation: To create a bar graph for this data, we would have the dealerships on the X-axis and the number of cars sold on the Y-axis. Each dealership would have a bar representing the number of cars sold, with the height of the bar corresponding to the number of cars sold by that dealership.
Practice Questions on Bar Graph
I. Consumers were addressing their preferred ice cream flavours in a survey.
Study the bar graph and answer the following questions: (1-3)
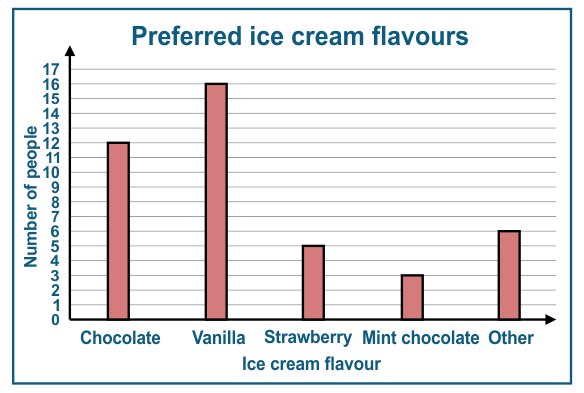
1. How many people prefer vanilla over chocolate flavour in ice creams?
a) 2
b) 4
c) 6
d) 8
Answer: b) 4
2. How many people like mint chocolate-flavoured ice cream?
a) 3
b) 4
c) 5
d) 7
Answer: a) 3
3. What is the total number of people participated in the survey?
a) 23
b) 32
c) 40
d) 42
Answer: d) 42
II. A school conducted a survey to know the favourite sports of the students.
The table below shows the results of this survey. (4-6)
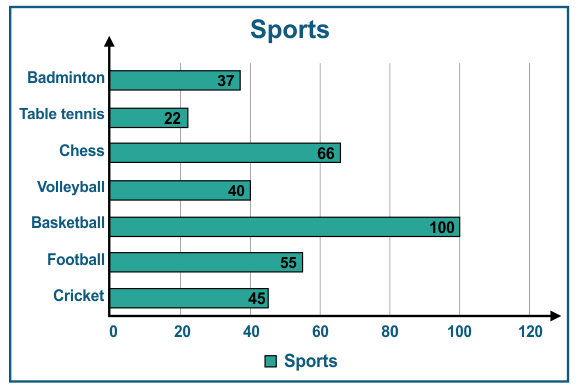
4. How many students do not have chess as their favourite sport?
a) 214
b) 299
c) 350
d) 123
Answer: b) 299
5. How many total numbers of students participated in a sports survey?
a) 335
b) 350
c) 365
d) 400
Answer: c) 365
6. If the total number of students in a school is 1089. How many students did not participate in the survey?
a) 500
b) 632
c) 707
d) 724
Answer: d) 724
III. Robert and his friends uploaded four kinds of movies on their YouTube channel, and they recorded their view in the form of a bar graph as shown below.
Examine the bar graph carefully and answer the following questions: (7-10)
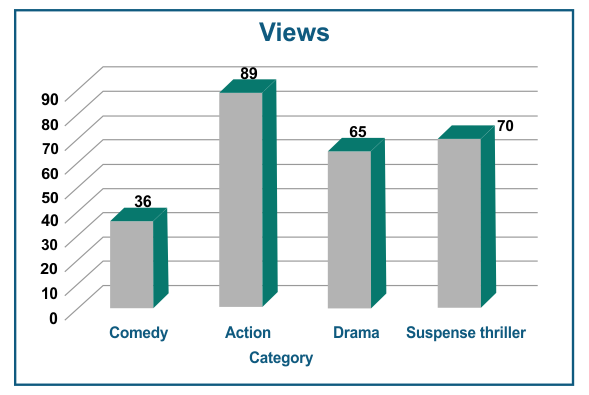
7. Which category got the maximum number of views?
a) Comedy
b) Action
c) Drama
d) Suspense thriller
Answer: b) Action
8. What is the total number of views in all the categories?
a) 100
b) 150
c) 178
d) 260
Answer: d) 260
9. Which category got minimum number of views?
a) Suspense thriller
b) Action
c) Comedy
d) Drama
Answer: c) Comedy
10. Robert and his buddies discussed accomplishing the target of more than 155 views in two categories at the same time. Which of the following two categories fulfilled their wish?
a) Action and comedy
b) Suspense thriller and comedy
c) Suspense thriller and action
d) Action and drama
Answer: c) Suspense thriller and action