Questions for Bar Graph

Bar Graph - Sub Topics

  • Bar Graph
  • Types of Bar Graph
  • Properties of Bar Graph
  • Parts of Bar Graph
  • Bar Graph

    A bar graph is a chart that uses bars to represent different values or quantities. The bars can be arranged vertically or horizontally, and they can be used to compare different categories or data sets. Bar graphs are commonly used to display data in a simple, easy-to-understand format and they can be used for both discrete and continuous data.

    The height or length of each bar represents the value or quantity for a particular category or data point. Bar graphs are often used to compare and contrast different sets of data and can be useful for visualizing trends or patterns in data over time.

    bar-graph

    Types of Bar Graph

    There are several types of bar graphs, including:

    Horizontal Bar Graph

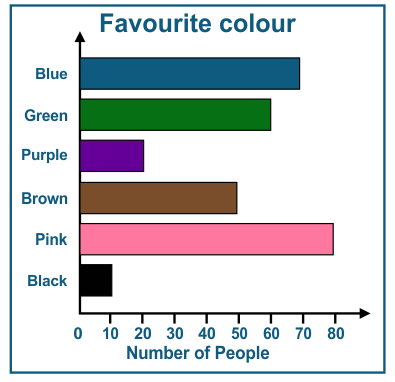
    This type of bar graph is used to compare data items by displaying them as horizontal bars. The length of each bar is proportional to the value it represents, so it can be used to easily compare the relative sizes of different data items.

    horizontal-bar-graph

    Vertical Bar Graph

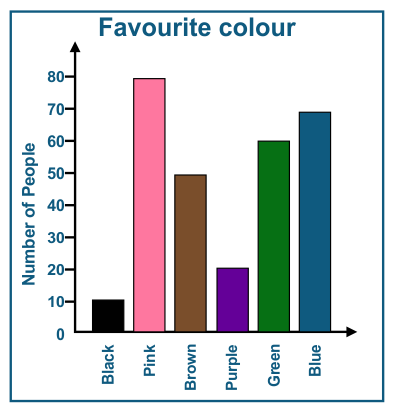
    This is the most common type of bar graph, which is used to compare data items by displaying them as vertical bars.

    For example: The vertical bar graph below consists of vertical bars that represent the number of people who like different colours. The y-axis represents the number of peoples, while the x-axis represents the different colours. The length of each bar corresponds to the number of people who like that particular colour.

    vertical-bar-graph

    Stacked Bar Graph

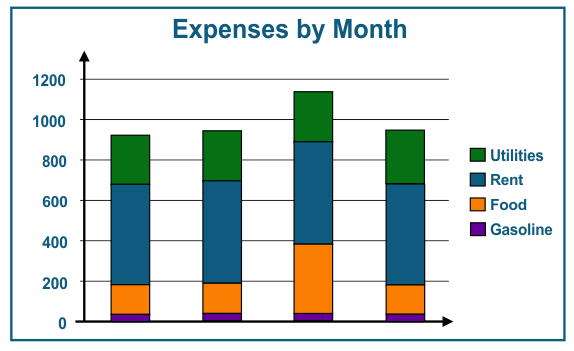
    This type of bar graph is used to show how much each item contributes to the total. It is also used to compare the total amounts across different categories.

    Stacked bar graphs are useful because they enable the viewer to easily compare the relative contributions of different parts to the total. They also allow for easy comparison of the total amounts across different categories.

    stacked-bar-graph

    Grouped Bar Graph

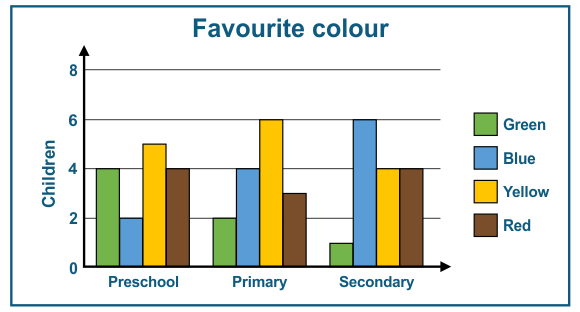
    This type of bar graph is used to compare data items within a specific category. It can be used to show how each individual item within the category relates to the others, and it can help to illustrate patterns and trends within the data. It is also useful for drawing comparisons between different categories.

    grouped-bar-graph

    100% Stacked Bar Graph

    This type of bar graph is used to show how each item contributes to the total, and also to compare the total amounts across different categories.

    Diverging Bar Graph

    This type of bar graph is used to show a positive and negative deviation from a central point or baseline.

    Flow Bar Graph

    This type of bar graph is used to show the flow of data over a certain period of time.

    Gantt Chart

    This type of bar graph is used in project management to show the duration of each task in a project and its dependencies.

    Properties of Bar Graph

    1. The bar graphs can be represented either horizontally or vertically.

    2. The width of the bar should be uniform and equally spaced.

    3. All the bar graphs must have a title, label, and scale.

    4. The length of the bar corresponds to the value of the given data.

    5. It must start with a frequency of 0.

    Parts of Bar Graph

    A bar graph typically has the following parts:

    X-axis: The horizontal axis that displays the categories being compared.

    Y-axis: The vertical axis that displays the values or measurements for each category.

    Bars: The rectangular shapes that represent the data for each category. The length of each bar corresponds to the value of the data point it represents.

    Scale: The scale of a bar graph refers to the numerical values that are used to represent the data being plotted on the graph. The scale determines the range of values that will be shown on the graph and the intervals at which those values will be marked.

    Labels: Both the side and the bottom of the bar graph have a label that tells what kind of data is shown. X-axis describes what each data point on the line represents and Y-axis shows the numeric value for each point on the line.

    Legend: A key that explains the meaning of different colours or patterns used in the graph, if applicable.

    Title: A brief description of the graph's overall topic or purpose.

    Share Your Feedback

    CREST Olympiads has launched this initiative to provide free reading and practice material. In order to make this content more useful, we solicit your feedback.

    Do share improvements at info@crestolympiads.com. Please mention the URL of the page and topic name with improvements needed. You may include screenshots, URLs of other sites, etc. which can help our Subject Experts to understand your suggestions easily.

    Mental Maths Related Topics

    70%