Statistics

Statistics - Sub Topics

  • What is Statistics?
  • Mathematical Statistics
  • Data Representation in Statistics
  • Measures of Dispersion
  • Measures of Central Tendency in Statistics
  • Relationship between Mean, Median and Mode
  • Solved Questions on Statistics
  • Practice Questions on Statistics
  • What is Statistics?

    Statistics is a branch of mathematics that deals with the collection, analysis, interpretation, presentation and organization of data. It plays a crucial role in various fields, including science, economics, social sciences and more. The primary goal of statistics is to make sense of large sets of data and draw meaningful conclusions from them. By employing mathematical techniques, statisticians can uncover patterns, trends and relationships that provide valuable insights into the underlying phenomena. In this article, we will explore the fundamentals of statistics, including data representation, measures of central tendency and their significance in mathematical statistics.

    Mathematical Statistics

    Mathematical statistics is the theoretical framework that underpins the methods used in data analysis. It involves the development and study of mathematical models and techniques to draw inferences from data. Mathematical statistics help statisticians design experiments, develop statistical models and make predictions or decisions based on data.

    Data Representation in Statistics:

    Before analyzing data, it must be appropriately represented. Data can be classified into two main types: qualitative (categorical) data and quantitative (numerical) data. Categorical data represent characteristics or attributes, such as gender, colour or types of fruits. Numerical data, on the other hand, represent quantities or measurements, such as age, weight or temperature. Data representation can be done through tables, graphs and charts, which provide a clear and concise way of presenting complex information.

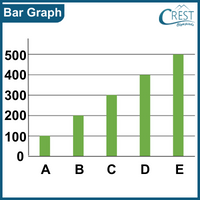
    statistics-bar-graph Bar graph- A bar graph is a visual representation of data using rectangular bars to display the values of different categories. The length or height of each bar corresponds to the quantity or frequency of the data it represents.
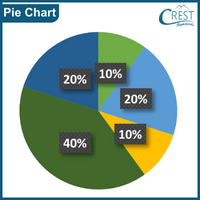
    statistics-pie-chart Pie chart- A pie chart is a circular graphical representation that visually displays data as "slices" of a pie, where each slice represents a proportion or percentage of the whole. It is commonly used to show how individual parts contribute to the total, making it easy to grasp the relative sizes of different categories within a dataset at a glance.
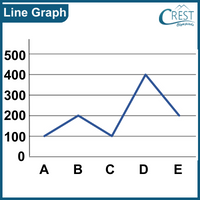
    statistics-line-graph Line graph- A line graph is a data visualization tool that represents data points as connected line segments. It is commonly used to show trends and changes in data over time or across different categories. The line graph allows for a clear visual representation of how the data varies and helps identify patterns and relationships between the variables.
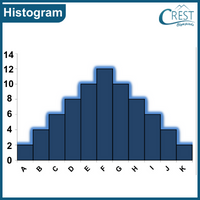
    statistics-histogram Histogram- A histogram is a graphical representation of a data distribution, where data is grouped into intervals or bins and the height of each bar corresponds to the frequency or count of data points falling within that bin. Histograms are commonly used in statistics and data analysis to gain insights into the shape and characteristics of a dataset.
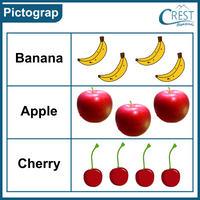
    statistics-pictograph Pictograph- A pictograph is a graphical representation of data using pictures or symbols to convey information. It is a simple and engaging way to present numerical information visually, making it easier for people, especially children, to understand and interpret data. Each picture or symbol in a pictograph represents a certain quantity, allowing viewers to quickly grasp the relative magnitudes or comparisons between different data categories.
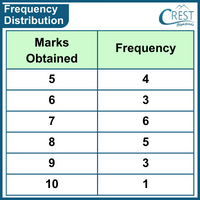
    statistics-frequency-distribution Frequency Distribution- A frequency table is created by organizing data values in ascending order and pairing each value with its corresponding frequency, often represented as "f." This table provides a structured and systematic representation of the data, making it easier to understand the distribution of values and their occurrence in the dataset.

    Measures of Dispersion

    Measures of dispersion, in statistics, are numerical indicators that quantify the spread or variability of a dataset. These measures provide valuable information about how the individual data points deviate from the central tendency, such as the mean or median. They help to understand the distribution of data and how widely the values are scattered around the central value.

    The two main types of measures of dispersion are:

    i. Absolute Measures of Dispersion:

    These measures express dispersion in the same units as the data and provide a direct representation of the spread. Common absolute measures of dispersion include:

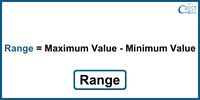
    Range: The range is the difference between the maximum and minimum values in the dataset.

    The formula of range:

    statistics-range

    Mean Absolute Deviation (MAD): MAD is the average of the absolute differences between each data point and the mean of the dataset.

    Variance: Variance is the average of the squared differences between each data point and the mean. It measures the average squared deviation from the mean.

    Standard Deviation: The standard deviation is the square root of the variance. It provides a more interpretable measure of dispersion compared to variance since it is in the original units of the data.

    ii. Relative Measures of Dispersion:

    These measures express dispersion as a proportion or percentage relative to the mean or another reference value. They allow for comparisons between datasets with different scales. Common relative measures of dispersion include:

    Coefficient of Variation (CV): CV is the ratio of the standard deviation to the mean, expressed as a percentage. It is used to compare the relative variability of datasets with different means.

    Relative Range: The relative range is the ratio of the range to the mean, expressed as a percentage. It indicates the relative spread of data around the mean.

    Measures of Central Tendency in Statistics

    In statistics, measures of central tendency are used to describe the central or typical value of a dataset. They provide insights into the "centre" around which the data tend to cluster. The three most common measures of central tendency are the arithmetic mean, the median and the mode.

    Arithmetic Mean:

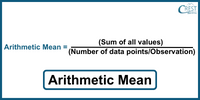
    The arithmetic mean, often simply called the "mean," is the sum of all values in a dataset divided by the number of data points. It represents the average value of the data. The formula for calculating the arithmetic mean is:

    statistics-arithmetic-mean

    The arithmetic mean is sensitive to extreme values, known as outliers and can be affected by their presence.

    Median:

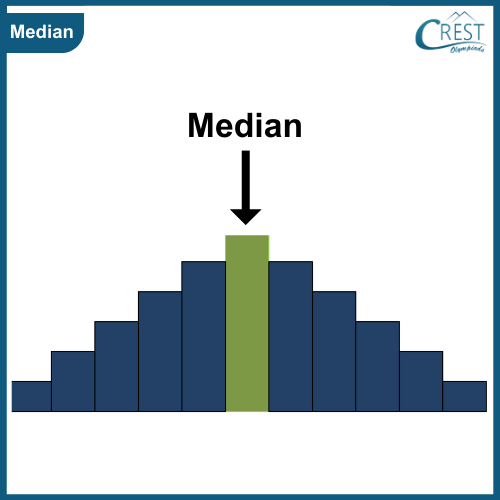
    The median is the middle value of a dataset when it is arranged in ascending or descending order. If the number of data points is odd, the median is the middle value itself. If the number of data points is even, the median is the average of the two middle values. The median is not influenced by extreme values and is considered a robust measure of central tendency.

    statistics-median

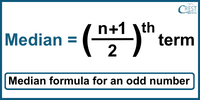
    Median formula for an odd number of observations
    When the total number of observations in a dataset is odd, then the formula of the median:
    statistics-median-odd-number
    where n is the number of observations

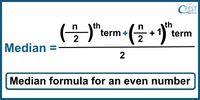
    Median formula for an even number of observations
    When the total number of observations in a dataset is even, then the formula of the median:
    statistics-median-even-number
    where n is the number of observations

    Mode:

    The mode is the value within a set of data that occurs more frequently than any other value, making it the value with the highest frequency of occurrence. In simpler terms, it is the data point that appears the most number of times in the given dataset.

    Relationship between Mean, Median and Mode

    In the case of moderately symmetric data, the relationship between the three measures of central tendency can be expressed through the formula:

    statistics-mode

    This formula allows us to relate the mode, median and mean of the data, providing insights into their relative positions within the distribution.

    Share Your Feedback

    CREST Olympiads has launched this initiative to provide free reading and practice material. In order to make this content more useful, we solicit your feedback.

    Do share improvements at info@crestolympiads.com. Please mention the URL of the page and topic name with improvements needed. You may include screenshots, URLs of other sites, etc. which can help our Subject Experts to understand your suggestions easily.

    Mental Maths Related Topics

    70%