Data Handling

Data Handling - Sub Topics

  • Data
  • Pictograph
  • Bar Graph
  • Pie Chart
  • Solved Questions on Data Handling
  • Data

    Data refers to information collected with a specific purpose in mind.

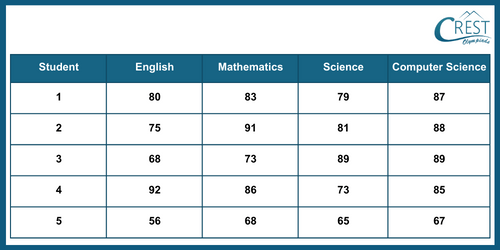
    For example, the table data represents the scores, each out of 100, achieved by five students across four distinct subjects.

    cmo-data-c6-1

    Observation:  An observation is each individual piece of information within a dataset.

    Raw Data: Raw or ungrouped data represents the data in its original. It is an unprocessed form of data.

    Array: An array is the arranging of observations in either ascending or descending order.

    Range: The range is the difference between the highest and lowest values within a dataset.

    Frequency: Frequency is the number of times a particular observation occurs in a dataset.

    Statistics: Statistics is the scientific field that encompasses the collection, presentation, analysis and interpretation of numerical data.

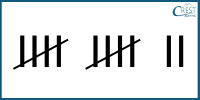
    Tally Marks: Tally marks are used to indicate the frequency of data. They are typically written as sets of five lines, with the first four lines drawn vertically and the fifth line running diagonally over the top of the previous four vertical lines, connecting from the top of the first line to the bottom of the fourth line.

    Counting Tally Marks: Counting tally marks is a method used to determine the frequency or the number of times a specific observation or data point occurs.

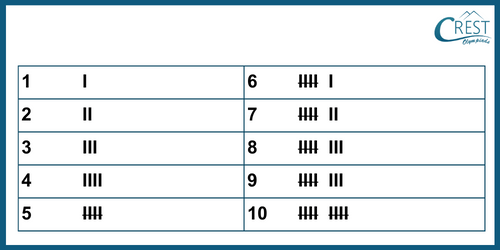
    cmo-data-c6-2

    Upon examining the table above, the following representations for numbers using tally marks are:

    1. One is symbolized by a single vertical line: ' | '.
    2. Two is conveyed through two vertical lines: ' | | '.
    3. Three is conveyed through three vertical lines: ' | | | '.
    4. Four is denoted by four vertical lines: ' | | | | '.
    5. However, the number five is uniquely represented as four vertical lines
      (' | | | | ') with a diagonal line (' \ ') drawn through them to form the numeral 5.

    Let us understand it with an example:

    Example: The marks obtained by 35 students are given.

    25, 45, 45, 25, 25, 45, 42, 42, 25, 25, 45, 25, 42, 25, 42, 45, 42, 25, 35, 42, 42, 45, 42, 35, 35, 45, 42, 42, 35, 35, 45, 42, 42, 35, 35

    Which of the following is the maximum frequency of marks obtained?

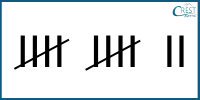
    a) cmo-data-c6-3
    b) cmo-data-c6-4
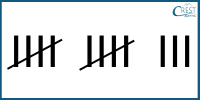
    c) cmo-data-c6-5
    d) cmo-data-c6-6

    Answer: c) cmo-data-c6-7

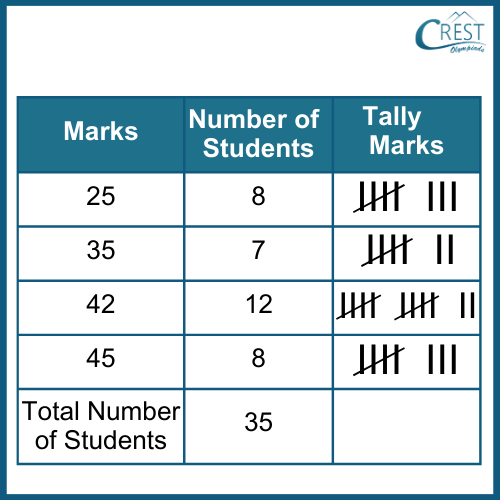
    Explanation: The frequency distribution table is shown as:

    cmo-data-c6-8

    Pictograph

    A pictograph is a technique for illustrating data using images or pictures. It is an exceptionally straightforward method for conveying statistical information and employing a key to signify the value of each image.

    Advantages:

    → Pictographs simplify the presentation of extensive data.
    → They are easy to provide all the information at a glance.
    → Pictographs are universally understandable, often requiring minimal explanation.

    Steps for Creating a Pictograph:

    Step 1: Gather the necessary data.
    Step 2: Choose a suitable image or picture for representation.
    Step 3: Create a key to associate each image with a specific value. In cases where the data frequency is high, numerical values may be used in the key.
    Step 4: Draw the pictograph.
    Step 5: Carefully review both the data and the pictograph to ensure accuracy.

    Creating a Pictograph

    Constructing a pictograph can be an engaging endeavour, yet replicating intricate images repeatedly may present challenges. To address this, simple drawings can be employed to symbolize the elements in the pictograph.

    Example: The following pictograph shows the number of animals and birds present in four zoological parks.

    cmo-data-c6-9

    How many animals and birds are present in all four zoological parks? 

    a) Animals: 2200, Birds: 1100
    b) Animals: 2450, Birds: 1225
    c) Animals: 2700, Birds: 1350
    d) Animals: 2950, Birds: 1475

    Answer: c) Animals: 2700, Birds: 1350

    Explanation: Numbers of animals = 225 × 12 = 2700
    Numbers of birds = 150 × 9 = 1350
    There are 2700 animals and 1350 birds present in all four zoological parks.

    Bar Graph

    A bar graph is an effective method for visually representing data. It offers a pictorial representation of numerical data using bars of consistent width which can be oriented either horizontally or vertically with equal spacing between them. The length of each bar corresponds to the numerical value it represents.

    Steps for Creating Bar Graphs:

    Step 1: Begin by drawing both a horizontal and a vertical line.
    Step 2: On the horizontal line, create bars to represent the data (numbers) and on the vertical line, label the numerals to indicate what the data represents.
    Step 3: Alternatively, you can interchange the items on the horizontal and vertical axes to represent the same data.
    Step 4: Maintain uniform bar width and equal spacing between the bars. If necessary, choose an appropriate scale for measurement, which may vary based on the provided data.

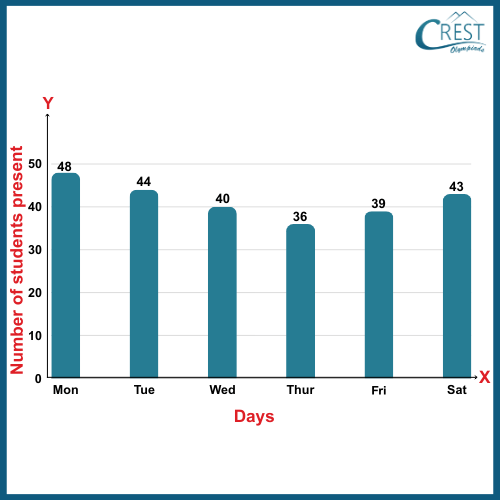
    Example: The bar graph shows the attendance of a class VI for the six days of a week as given below.

    cmo-data-c6-

    What is the number of students absent in all six days if the strength of the class is fifty and no students are repeatedly absent?      

    a) 25
    b) 35
    c) 40
    d) 50

    Answer: d) 50

    Explanation: No students are repeatedly absent.
    Number of students absent on Monday = 50 − 48 = 2
    Number of students absent on Tuesday = 50 − 44 = 6
    Number of students absent on Wednesday = 50 − 40 = 10
    Number of students absent on Thursday = 50 − 36 = 14
    Number of students absent on Friday = 50 − 39 = 11
    Number of students absent on Saturday = 50 − 43 = 7

    Total number of students absent in all six days
    = 2 + 6 + 10 + 14 + 11 + 7
    = 50

    Pie Chart

    A pie chart is a graphical representation used for visualizing data. It is also known as a "circle chart". In a pie chart, data is shown in the form of slices and each slice represents the size of a specific data category. The sum of all data in a pie chart always equals 360°.

    Steps for Creating a pie chart:

    1. Begin by organizing the given data in a table for ease of use.
    2. Calculate the total sum of all values in the table.
    3. To determine the percentage for each value, divide each value in the table by the sum and then multiply the result by 100.
    4. To find the degree measure for each data category, apply the formula: (Value of each component / Sum of all values) * 360 degrees.
    5. The central angle for a specific data category can be calculated using the formula: Central angle for a component = (Value of the component / Sum of all components) * 360 degrees.
    6. Create a circle and employ a protractor to measure the degree for each sector. This will help you accurately represent the data in the form of a pie chart.

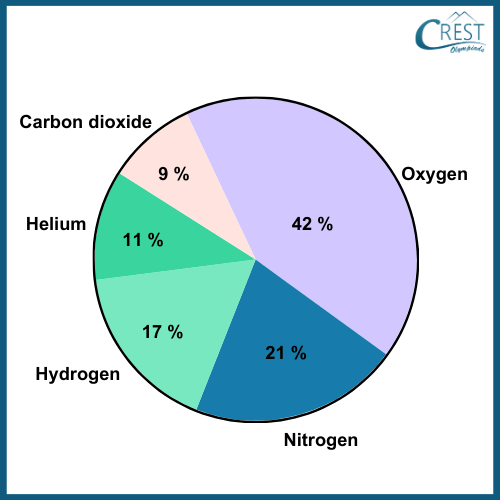
    Example: The pie chart shows the percentage of different gases in the mixture of fuel gas.

    cmo-data-c6-11

    What is the amount of hydrogen and oxygen gases present in the fuel gas if the total fuel gas is 1550 litres?

    a) 914 L 500 mL
    b) 1014 L 500 mL
    c) 1104 L 500 mL
    d) 1204 L 500 mL

    Answer: a) 914 L 500 mL

    Explanation: Amount of hydrogen present in fuel gas = 17% of 1550 L
    = 17/100 × 1550 L
    = 263.5 L

    Amount of oxygen present in fuel gas = 42% of 1550 L
    = 42/100 × 1550 L
    = 651 L

    Total amount of hydrogen and oxygen gases if the total fuel gas
    = 263.5 L +  651 L
    = 914.5 L
    = 914 L + 0.5 L
    = 914 L + 500 mL [1 L = 1000 mL]
    = 914 L 500 mL

    Share Your Feedback

    CREST Olympiads has launched this initiative to provide free reading and practice material. In order to make this content more useful, we solicit your feedback.

    Do share improvements at info@crestolympiads.com. Please mention the URL of the page and topic name with improvements needed. You may include screenshots, URLs of other sites, etc. which can help our Subject Experts to understand your suggestions easily.

    Maths Related Topics for Class 6

    70%