Solved Questions on Pictographs
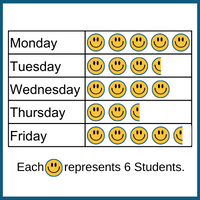
Edward is a teacher who wants to take a special class for the children so, for that he has taken a survey among his students. He recorded the number of students who are interested in attending special classes on weekdays in the form of a pictograph shown below.
Study the pictograph and answer the following questions:
1. How many students are interested in attending the special class on Monday?
a) 5
b) 15
c) 20
d) 30
Answer: d) 30
Explanation: Monday = 5 smileys
Each smiley = 6 students
Therefore, the total number of students = 5 x 6 = 30 students.
2. What is the sum of students that are interested in attending the special class on Friday and Thursday?
a) 42
b) 27
c) 30
d) 36
Answer: a) 42
Explanation: Number of students interested on Thursday = 2.5 x 6 = 15
Number of students interested on Friday = 4.5 x 6 = 27
Therefore, Sum = 27 + 15 = 42
3. If the total strength of a class is 187. How many students are not interested in attending special classes on any days mentioned in the pictograph?
a) 114
b) 117
c) 121
d) 70
Answer: d) 70
Explanation: Total number of students in class = 187
Total number of students interested in attending special classes = 19.5 x 6 = 117
Total number of students who are not interested = 187 – 117 = 70 students.
4. What is the total number of students who are interested in attending special classes on the day after Thursday?
a) 17
b) 18
c) 27
d) 14
Answer: c) 27
Explanation: Total number of students interested to attend a special class on the day after Thursday
i.e., Friday = 4.5 x 6 = 27
5. On which of the following day least number of students are interested?
a) Thursday
b) Wednesday
c) Friday
d) Monday
Answer: a) Thursday
Explanation: Thursday = 2.5 x 6 = 15
6. The pictograph represents the number of boys and the number of boys who ride bikes to school. Each boy icon represents 5 boys.
a. How many boys are in total?
b. How many of them ride bikes to school?
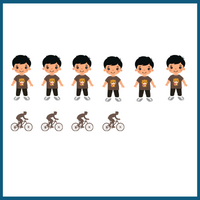
Answer: The pictograph represents the number of boys and the number of boys who ride bikes to school. Each boy icon represents 5 students.
a. There are 30 (6 x 5) boys in total.
b. 20 (4 x 5) of them ride bikes to school.