Data Handling

Data Handling - Sub Topics

In our rapidly evolving world, data has become an important resource. We generate and consume data about quantities and the ability to handle and make sense of this information is crucial. Data handling is the process of collecting, organizing, analyzing and interpreting data to extract valuable insights. In this chapter, we will explore the significance of data handling and its various aspects.

  • Data
  • Mean
  • Median
  • Mode
  • Bar Graph
  • Pie Chart
  • Probability
  • Solved Questions on Data Handling
  • Data

    Data is information collected for a specific purpose.

    Raw Data: Raw data is information obtained in its original and unprocessed form.

    Range: The range of data is the difference between the highest and lowest values in the dataset.

    Range = Highest value Lowest value

    Array: An array involves arranging numerical data in either ascending or descending order.

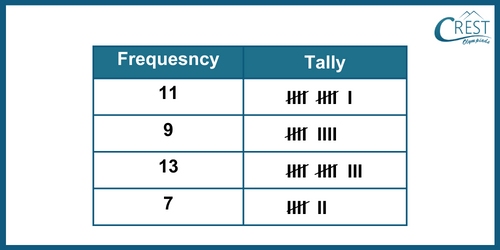
    Frequency: Frequency is the number of times a particular observation occurs in the dataset.

    Frequency Distribution Table: A frequency distribution table, or frequency table, displays the frequencies of different observations in the data.

    Ungrouped Frequency Distribution: When raw data is tabulated with their respective frequencies, it's called ungrouped frequency distribution.

    Tally Marks: Tally marks are used when dealing with a large number of observations to count their frequencies.

    cmo-data-c7-1

    Grouped Data and Class Interval: Grouped data involves organizing long lists of observations into intervals known as class intervals.

    Lower Limit and Upper Limit: The lower value of a class interval is referred to as the lower limit, while the upper value is the upper limit.

    Class Interval Width or Size: The width of a class interval is the difference between two consecutive upper or lower limits.

    Class Mark: The class mark is the midpoint of a class interval and is calculated as the average of the lower and upper-class limits.

    Class mark = (Lower class limit + Upper class limit)/2

    Mean

    The mean is the average value of the dataset and is computed by dividing the sum of all observations by the total number of observations.

    cmo-data-c7-2

    Median

    The median is the middlemost value of the data when arranged in ascending or descending order.

    If there is an odd number (n) of observations,

    cmo-data-c7-3

    If there is an even number (n) of observations,

    cmo-data-c7-4

    Mode

    The mode is the observation that appears most frequently in the dataset.
                                           
    Mode = Value at highest frequency 

    Empirical Formula: The empirical formula states that the mode is approximately equal to 3 times the median minus 2 times the mean.

    Mode = 3 Median – 2 Mean

    Bar Graph

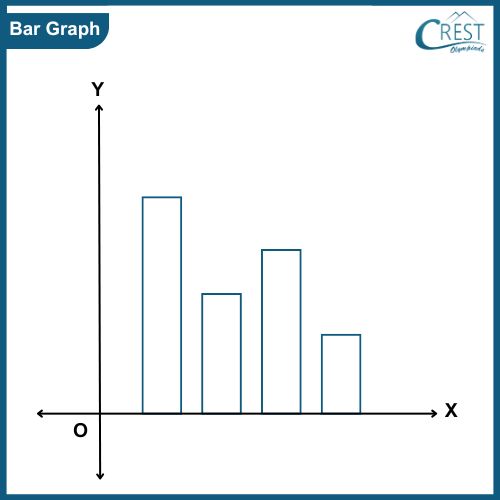
    A bar graph is a graphical representation that is used when dealing with ungrouped data. They consist of axes and a series of labelled horizontal or vertical bars that convey information about the data.

    cmo-data-c7-5

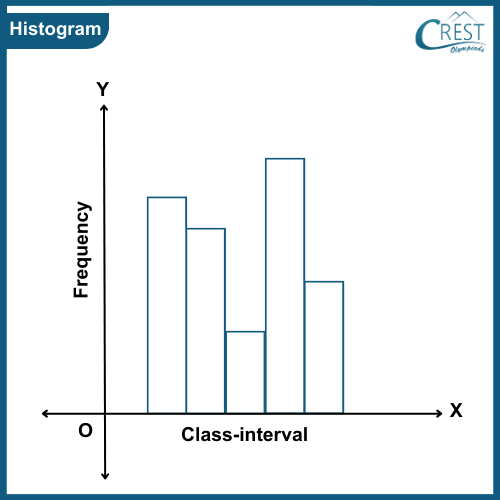
    Histogram: A histogram is a visual representation of data that has been grouped into intervals. It displays these intervals on the horizontal axis and their corresponding frequencies on the vertical axis usually along the x and y axis. The histogram is drawn in such a way that there is no gap between the bars.

    cmo-data-c7-6

    Pie Chart

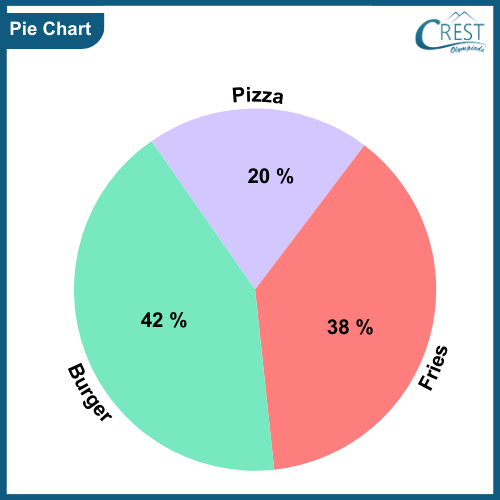
    A pie chart is a graphical way to represent numerical data. It uses sectors of a circle to describe different components of the data. The central angle for each sector is determined by the formula:

    cmo-data-c7-7

    cmo-data-c7-8

    Event: An event refers to either a single outcome or a combination of outcomes resulting from an experiment.

    Probability

    Probability is the chance of the occurrence of a certain event. Probability means possibility. It is a numerical measurement of the chances associated with that event.

    The probability of a certain event is always 1 and the probability of an impossible event is always 0.

    In all cases, the probability falls within the range of 0 to 1.

    The probability of an event is determined by the formula:

    cmo-data-c7-9

    Share Your Feedback

    CREST Olympiads has launched this initiative to provide free reading and practice material. In order to make this content more useful, we solicit your feedback.

    Do share improvements at info@crestolympiads.com. Please mention the URL of the page and topic name with improvements needed. You may include screenshots, URLs of other sites, etc. which can help our Subject Experts to understand your suggestions easily.

    Maths Related Topics for Class 7

    70%