Speed, Time, and Distance - Class 7 Notes & Olympiad Questions

Speed, Time, and Distance - Class 7 Science

  • Speeds and its Measurement
  • Time
  • How are Speed and Time Related?
  • Uniform and Non-Uniform Speed
  • Distance-Time Graph
  • Velocity and its Distinction from Speed
  • Simple Pendulum and its Time Period
  • Solved Questions on Speed, Time and Distance
  • Speed and its Measurement

    a) Speed is a physical quantity that measures the fastness or slowness of an object's motion. It tells us how quickly something travels a certain distance.
    b) Speed is defined as the distance covered by an object in a unit of time. By comparing the distances covered by objects moving in the same direction for a given time, we can determine their relative speeds.
    c) A faster-moving object covers more distance in a given time than a slower-moving object.
    d) Speed is typically measured in metres per second (m/s) or kilometres per hour (km/h). Metres per second tells us how many meters an object covers in one second, while kilometres per hour tells us how many kilometres an object covers in one hour.

    Time

    a) Time is a way to measure the duration or how long something takes.
    b) Time is an essential element in the study of motion. It is the interval between two events and allows us to track changes and measure durations.
    c) The standard unit for measuring time is the second (s), which is widely used in scientific calculations. Other units, such as hours, months, years, or decades, are also employed to measure longer durations.
    d) Different units of time provide flexibility in expressing various scales of temporal intervals.

    How are Speed and Time Related?

    Speed and time have an inverse relationship. When an object moves faster, it takes less time to cover a certain distance. Similarly, if an object moves slower, it takes more time to cover the same distance.

    Formulas of Time and Distance

    To calculate speed, we divide the distance travelled by the time it takes to cover that distance. So, if you travelled a distance of 100 meters in 10 seconds, the speed would be:

    Speed = Distance / Time

    Speed = 100 meters / 10 seconds
    Speed = 10 meters per second (m/s)

    This means that you're covering 10 meters every second you're moving.

    Real-Life Examples

    Let's look at a couple of real-life examples to better understand speed and time

    1. Imagine a car driving at a speed of 60 km/h. If it travels for 2 hours, you can calculate the distance covered. Using the speed formula, we have:

    Speed = Distance / Time
    60 km/h = Distance / 2 hours

    Rearranging the formula, we find:

    Distance = Speed × Time
    Distance = 60 km/h × 2 hours
    Distance = 120 kilometres

    So, in 2 hours, the car would have covered a distance of 120 kilometres.

    2. Suppose you're running a race and you cover a distance of 200 meters in 30 seconds. To find your speed, we divide the distance by the time:

    Speed = Distance / Time
    Speed = 200 meters / 30 seconds
    Speed = 6.67 meters per second (m/s)

    Therefore, your speed during the race is approximately 6.67 meters per second.

    Uniform and Non-Uniform Speed

    Uniform Speed

    Non-Uniform Speed

    Uniform speed refers to the motion of a body where it covers equal distances in equal intervals of time.

    Non-uniform speed occurs when a body covers unequal distances in equal intervals of time. 

    Speed remains constant over time

    Speed changes throughout the motion

    Examples: a car travelling at a steady speed on a highway

    Examples: a car in city traffic, a roller coaster ride with varying speeds

    Distance-Time Graph

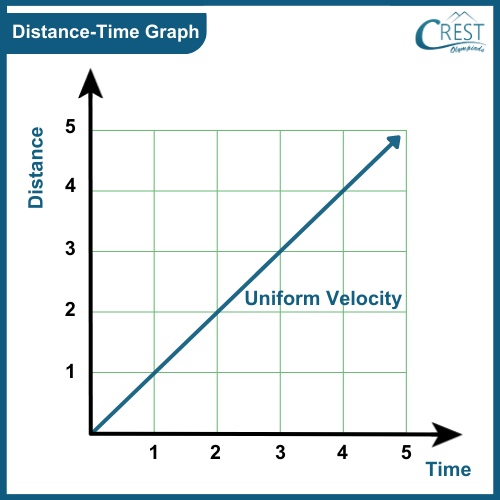
    A distance-time graph is a graphical representation that shows how the distance travelled by an object changes over a specific period of time. The horizontal axis (x-axis) represents time, while the vertical axis (y-axis) represents distance.

    Graph of Distance Time - How to find Uniform Velocity

    Interpreting a Distance-Time Graph

    To understand a distance-time graph, we need to know how to interpret its key features:

    Slope: The slope or steepness of the line on the graph indicates the object's speed. A steeper line represents a higher speed, while a flatter line represents a slower speed. A horizontal line indicates that the object is not moving (at rest).

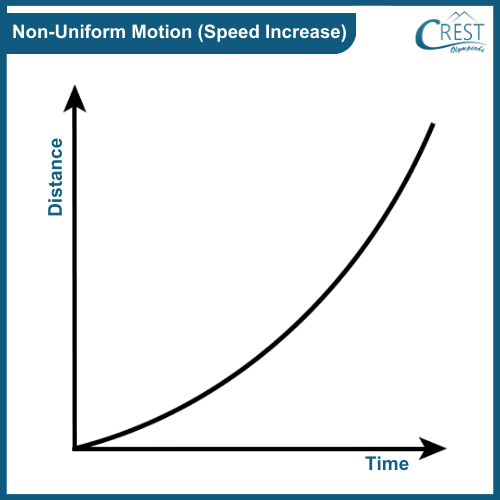
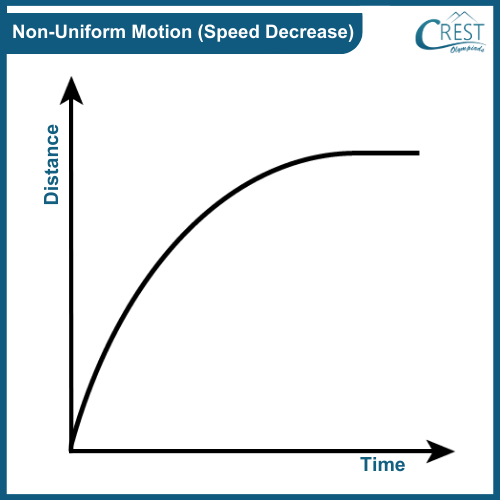
    The shape of the Line: The shape of the line on the graph can tell us about the object's motion. A straight line indicates constant speed (uniform motion), while a curved line represents changing speed (non-uniform motion).

    Distance: The vertical position on the graph at a specific time represents the distance travelled by the object. By reading the value on the y-axis, we can determine the distance covered by the object at a particular time.

    Understanding the Graph

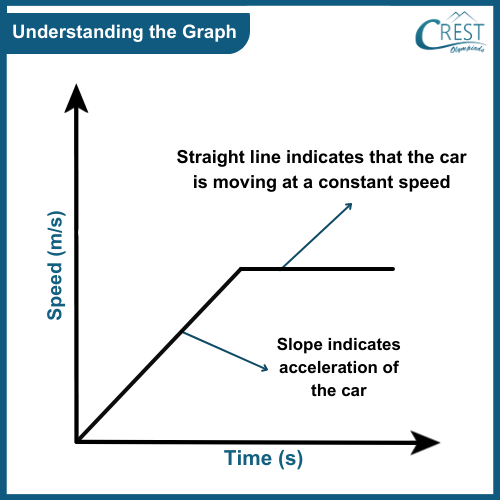
    Understanding the distance time graph - Science Grade 7

    a) The slope of the line indicates the car's speed. If the line is steeper, it means the car is moving faster.
    b) If the line is straight, the car is moving at a constant speed. If the line is curved, the car's speed is changing.
    c) The distance between points A and B represents the total distance travelled by the car.
    d) By looking at specific time values on the x-axis, we can read the corresponding distance travelled on the y-axis.

    Different Types of Distance-Time Graphs

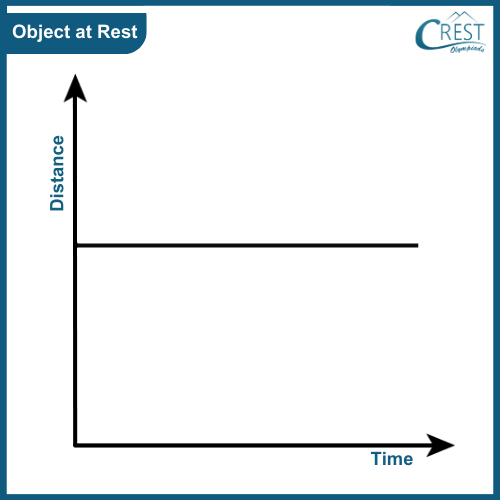
    1. For a stationary object, the distance-time graph is a straight line that runs parallel to the time axis. This indicates that the object is not moving and remains at a fixed position.

    Different Types of Distance Time Graphs - Object at Rest

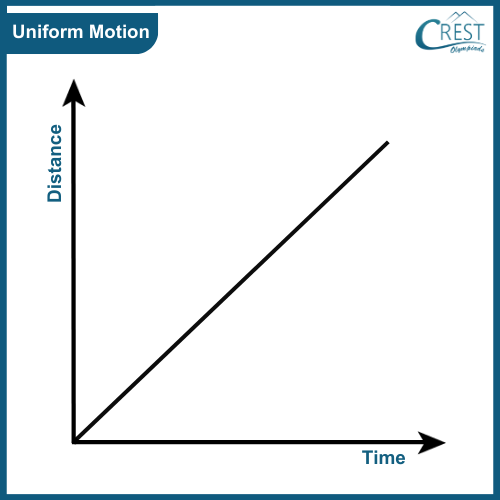
    2. When an object moves with a uniform speed, the distance-time graph appears as a straight line with a non-zero slope. This means that the object covers equal distances in equal intervals of time. The slope of the line represents the object's constant speed.

    Different Types of Distance-Time Graphs - Uniform Motion

    3. If the speed of an object increases with time, the distance-time graph shows a curved line that becomes steeper as time progresses. This indicates that the object is accelerating, covering greater distances in each subsequent time interval.

    Different Types of Distance-Time Graphs - Non-Uniform Motion (Speed Increase)

    4. Conversely, when the speed of an object decreases over time, the distance-time graph displays a curved line that becomes less steep as time passes. This suggests that the object is decelerating or slowing down, covering shorter distances in each subsequent time interval.

    Different Types of Distance-Time Graphs - Non-Uniform Motion (Speed Decrease)

    Velocity and its Distinction from Speed

    a) Velocity is similar to speed but includes the concept of direction.
    b) It is defined as the distance travelled by an object in a unit of time in a specific direction.
    c) Velocity can also be understood as the displacement per unit of time.

    Velocity = Displacement / Time

    d) The unit of velocity is the same as speed, commonly expressed in m/s or km/h.
    e) Unlike speed, which only considers the magnitude of motion, velocity takes into account both the magnitude and direction of the object's displacement.

    Simple Pendulum and its Time Period

    a) A simple pendulum is a system consisting of a mass (bob) attached to a string or rod, allowing it to swing back and forth.
    b) The time taken by the bob to complete one oscillation, from one extreme position (A) to the other (B) and back to the mean position (O), is called its time period.
    c) The time period of a simple pendulum depends solely on its length and is independent of the mass, shape, or size of the bob.
    d) This property makes the simple pendulum a useful tool for measuring time accurately in certain applications.

    Diagram of Simple Pendulum - Science Grade 7

     Explore more about Force and Pressure

    Share Your Feedback

    CREST Olympiads has launched this initiative to provide free reading and practice material. In order to make this content more useful, we solicit your feedback.

    Do share improvements at info@crestolympiads.com. Please mention the URL of the page and topic name with improvements needed. You may include screenshots, URLs of other sites, etc. which can help our Subject Experts to understand your suggestions easily.

    Other Science Related Topics for Class 7

    70%